Dee,
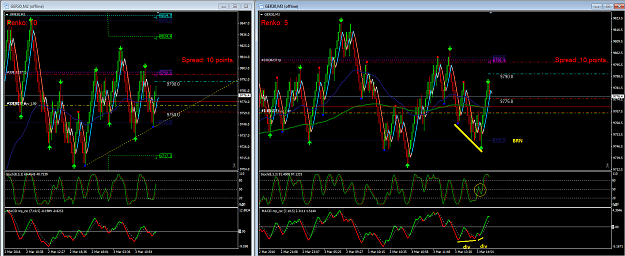
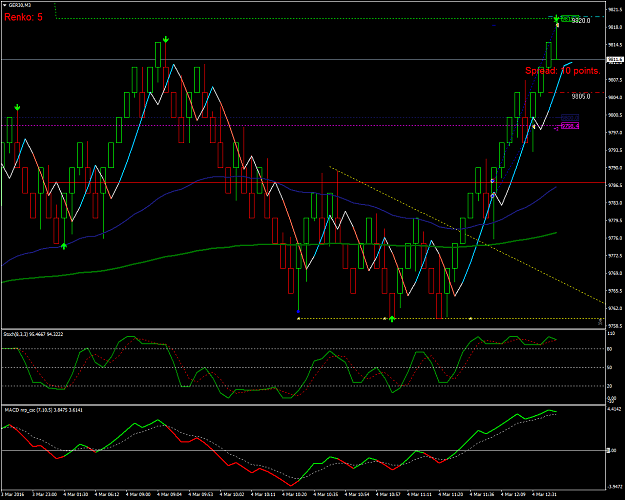
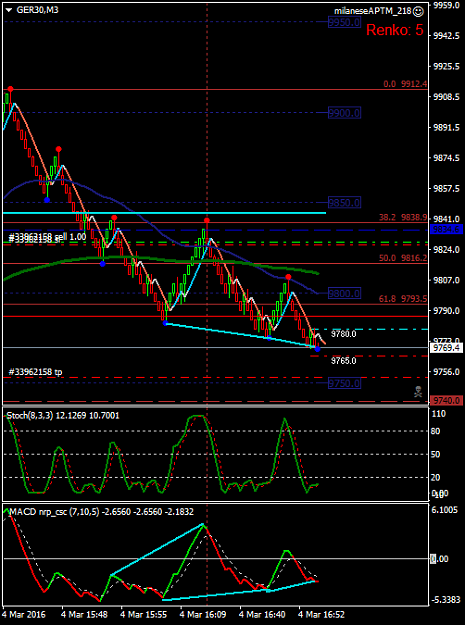
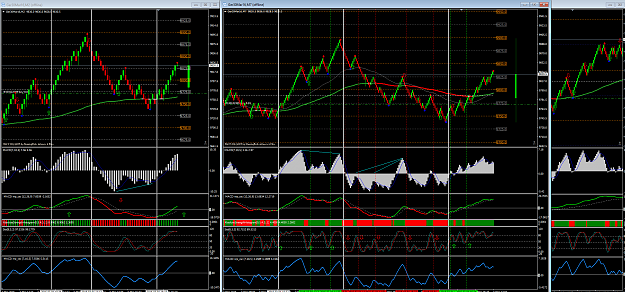
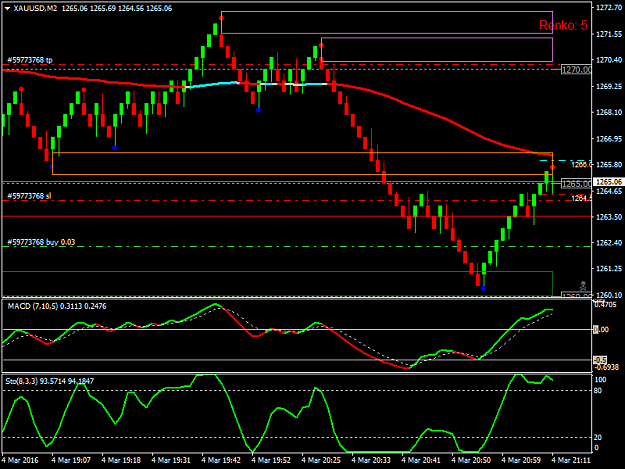
This chart is very representative. I see your bias was long, and you were expecting a bounce at the upper blue line, which was a resistance from previous days.
Then you saw a small 123 pattern close to that area, with both indicators confirming short, so you took the shot. I also see from other charts from you, that some times you wait for 123, and some other you go direct, no matter is a countertrend.
My only real question is in your annotations in the indicators. I don't know how to read and interpret "what happened here" and "what's this". Can you please clarify what you see in those small oscilations?
By the way, not to cause pitty, today I've blown my account. Need to rethink on a way to determine my trading bias, and when to change bias. What it is true, the MACD changes color, not sure if only in the ongoing candle, or also affects previous one. I may need to wait one more candle to close.
Thanks for your inputs
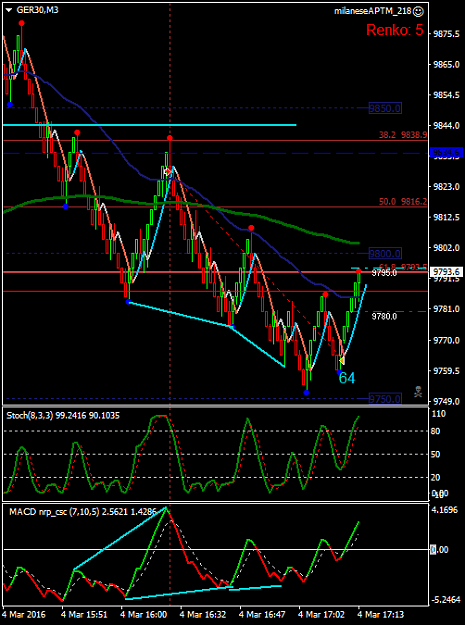