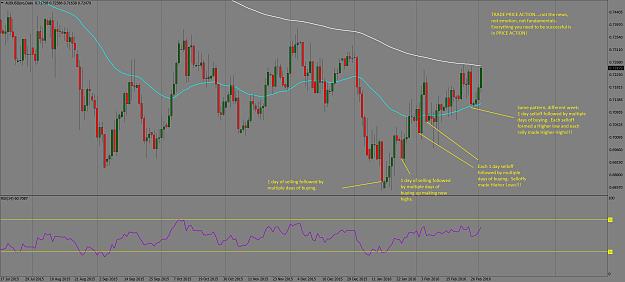
DislikedHere's one other chart for you....remember last week I said to look at the Aussie Daily chart for early and mid February??? Notice what happens every time there is a 1 day selloff on Aussie? Price spends the next few days rallying. There is NEVER any follow through on the selling. Something changed in the market back in the middle of January when price bottomed out around .6830. Price rallied right back up above .7000 since then and hasn't been able to close on the Daily chart below .7000 for the entire month of February. Those are just some other...Ignored
Hey PA very good chart analysis and every time I think short AUD you give me reason for caution. Here are a few numbers to look at on the flip side of what you have
pointed out here. Deja vu, AU has hit highs at these levels three times previously in the last 30 days., starting 4th Feb. Within 1 to 2 days after hitting those heights, the
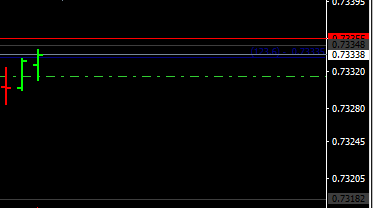
pair dropped, in consecutive order, to .7060; .7146; and last time .7118. I'm short from .7237 this time. Soooo I'm targeting .7132 (half way between last 2 lows) within
2 days, maybe tomorrow.

