{quote} Hi elsensei. This question is wrong on so many levels i don't know where to start! The question and thread title should be: How much time should i waste on PA and TF's? rgds
Ignored
Please elaborate. do you think PA is waste of time?
{quote} hey baron, so what is price action then ? And is it more profitable than the price action people been talking about in this thread ? thanks.
Ignored
Thats a good question and I am glad you asked. I went into a little detail about 'Price Action' in this post here and for clarity here is the actual post.
I'd like to add something to this as the phrase "price action" is quite ambiguous. Many readers here on FF believe that 'price action' is the reading of a chart and identifying certain candle formations, to identify strength/weakness and even individual entries. For example, taking a short on the break of a low of a 'bearish pin bar' formation. 'AbsoluteVolatility' analysis such as this is not reading price action and I believe that it is through the use of the term 'price action' by commercial interests, that had added to the confusion.
The truth is that there is no objective description to 'price action', since it envelopes many different forms of analysis. Reading 'price action' is more about 'RelativeVolatility' analysis and monitoring 'relationships' amongst different asset classes, to provide you with information that might not be known amongst other market participants.
There are lots of ways to monitor 'price action' and I will mention a few here in attempt to clear up the confusion.
Say if I were to look at going long the S&P on an upside breakout yet, when the S&P breaks out the NQ and the DOW fail to follow suit and actually form a new intraday low. This is telling me something very important in that I should not expect the rally in the S&P to be sustained. If I were watching the energy markets and nearly all the classes are breaking out to the upside yet crude is failing to rally. Just this could turn me bearish on crude. Jesse Livermore also made a few examples of price action in his books when he talks about stocks failing to respond correctly to good or bad news etc.
UnamedPlayr has also brought examples to the table in how he is building replica instruments to have something to compare the action of one instrument to another.
Reading 'price action' is no easy task and takes years of market experience to be able to recognise, which is why I believe it to be an 'edge' over other participants. Anyone who has interest in furthering this should look at away of designing a framework to assist in monitoring 'price action'. Provided this is done correctly I am sure you will be heavily rewarded for the time taken in doing so.
To add a little further to this watching and trading only a single asset class, is a very naive and inferior way of watching the markets. So to is trying to make unsubstantiated claims about how the underlying liquidity is structured. Nobody can say with any degree of certainty, that there is stops here, bids there or that X participants who are long here will have to exit if price breaks this low. Since the market is a collection of players acting in a non-rational manner making idol assumptions like these are a quick way to losing your account. In his book, Education of a Speculator, Victor Niederhoffer (1997) writes about markets being similar to an ecosystem. Trying to rationalise as to how all these individual species will act, at any given time to an event or price change, has to be near on impossible to predict. There are just too many unknown variables to account for.
Looking at only one instrument gives you very little information about what is going on. 'Price action' is a type of comparative analysis, in that you are always observing how one market is 'acting' relative to something else. That something else could be another product/news/sentiment/weather/wars etc. Since it is so dynamic it also cannot be backtested, but this gives it the advantage that algos are very unlikely to take it away - in fact algos will actually provide you with your liquidity.
It makes me laugh when I hear FF members saying that you should just concentrate on trading one product. Off the top of my head I hear people putting figures out that the market only moves 20-30% of the time. If thats really the case then why would you waste all your time waiting for market to become ready? Instead you should be going out and looking for a market thats ready for you to trade. This doesn't mean buying Gold now because of all the media attention its getting, this would actually put me off, it means going out and finding something that is 'acting' ready for trading.
Before writing this I did a few searches to see if I could find any posters who could elaborate further on this topic but found zero. Yes that also includes the famous ones here.. A big contribution to my own success came when I challenged all the axioms, that I had formed based on the opinion of others, either here on FF or from mentors, that I had wasted my money on. This is a task that I cannot recommend more highly. Staking your finances on the foolish, unsupported claims of others is quick route to a margin call and is unfortunately a road that is taken by the majority.
Price Action: The bar to bar relationship of closes, ranges, velocity of prices and the ensuing patterns they create and their relationship to the standard metrics EMA, SMA, BBands. That's all their is, that's all you need. Everything else is largely inconsequential. The market has no memory beyond the few bars preceding the current bar.Nothing is random except news events.As surely as night follows day price direction follows price action and is predictable if properly interpreted.
A currency pair moves because of the activity of buying and selling of market participants. The only thing that you need to be good at is spotting when the major players are moving the markets. These market participants are so big that most of the times they would have to agree with each other. Sometimes they try to outsmart each other but in the end the most powerful will come and the others will have to follow. I suspect only a few controls the market be it short term or long term.
Focusing on only one instrument and know everything about it would help a lot.
Price Action: The bar to bar relationship of closes, ranges, velocity of prices and the ensuing patterns they create and their relationship to the standard metrics EMA, SMA, BBands. That's all their is, that's all you need. Everything else is largely inconsequential. The market has no memory beyond the few bars preceding the current bar.Nothing is random except news events.As surely as night follows day price direction follows price action and is predictable if properly interpreted.
Ignored
Very well said. The market is as important as the last bar! All of the guessing which entails those higher tf positions, all come from the lower tf setups.
Price Action: The bar to bar relationship of closes, ranges, velocity of prices and the ensuing patterns they create and their relationship to the standard metrics EMA, SMA, BBands. That's all their is, that's all you need. Everything else is largely inconsequential. The market has no memory beyond the few bars preceding the current bar.Nothing is random except news events.As surely as night follows day price direction follows price action and is predictable if properly interpreted.
Ignored
Of course thats why financial institutions pay some of the the largest salaries & bonuses in the world, to get hold of the best statisticians/quants/programmers to analyse as you say "The bar to bar relationship of closes, ranges, velocity of prices and the ensuing patterns they create and their relationship to the standard metrics EMA, SMA, BBands.".
A currency pair moves because of the activity of buying and selling of market participants. The only thing that you need to be good at is spotting when the major players are moving the markets. These market participants are so big that most of the times they would have to agree with each other. Sometimes they try to outsmart each other but in the end the most powerful will come and the others will have to follow. I suspect only a few controls the market be it short term or long term. Focusing on only one instrument and know everything about it would...
Ignored
Is it possible for you to quantify any of the axioms that you have just posted? If not are you really risking money on idle metaphysics?
In your post you say that "The only thing that you need to be good at is spotting when the major players are moving the markets". So do these big players use a single currency pair to make a transaction? For example say if market participant x wants to buy a few billion dollars, will he make that whole transaction through maybe the eurusd? Because if that is not the case, which I don't believe it is then your next statement "Focusing on only one instrument and know everything about it would help a lot" is also false.
{quote} Please elaborate. do you think PA is waste of time?
Ignored
PA=price movement or prices in action.
So it is the flow of money(no flow of money, no action) here and now, and is not limited to one instrument or asset class.
The financial system is, well, a 'system'.
Things are connected and you need to work out the connections.
If you are watching the 'action' of prices on a single instrument then you are shutting out information that is relevant to making good trading decisions.
(See red's posts)
Here is a post i just recently made discussing why i took the trade i did and how i was looking at various instruments which gave me a feel of the flow of money through the system at the time.
The trade wasn't 'perfect', but i had 'situational awareness'. I knew what i was doing and why i was doing it. I knew what to look at and when, helping me to make solid trading decisions. http://www.forexfactory.com/showthre...00#post8752000
Too many folk on trading forums are getting their panties in a twist wasting time trying to work out which TF is the 'right' one! And what patterns etc are the most profitable.
You will reach profitability when you can understand the market and how it works.
Wasting time on how trade is represented is futile.
{quote} Is it possible for you to quantify any of the axioms that you have just posted? If not are you really risking money on idle metaphysics? In your post you say that "The only thing that you need to be good at is spotting when the major players are moving the markets". So do these big players use a single currency pair to make a transaction? For example say if market participant x wants to buy a few billion dollars, will he make that whole transaction through maybe the eurusd? Because if that is not the case, which I don't believe it is then...
Ignored
1. If you have access to DOM you would see EURUSD and GBPUSD has their own book. So each is different and not directly related.
2. As for a few major market participants having the control on the markets, seek the reports on which banks have the highest market share in fx.
Hello all good night or day for yall. Price action is better way to get forex in your hands, thats my thougt. But, which is the better TF to trade using support and resistance and sup/dem zones? Really price action Works on all TF? Which TF give us better result using: Double bottom or double top, trend lines, S or R, retracement or pullbacks, HH or LL, pivots. ? Now i trade using H4 and sup dem and S R but i want better results with my strategy. What do you recommend to avoid retracement or pullbacks? Sorry my bad english. I wait someone help me...
Ignored
This question is so wrong in so many ways,Why trade multiple time frames to give u a signal..No one in this World can 100% predict the market,the sooner you understand that,the sooner ull stick to a clear 'Timeframe" to trade on..
Fyi price isnt a function of time and trade with what you see is HAPPENING NOW! Not what will happen in 1hr or 4hr or a month.
The biggest mistake traders that ive seen time and time again is they "expect pullbacks",dont trade expectations.
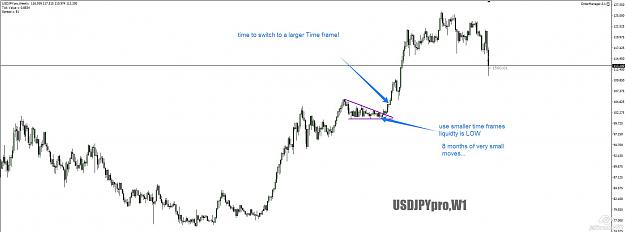
Never Force your timeframe onto the market! Here is why..
Liquidty changes in the market... So choosing a timeframe is tricky.. Look at Daily, weekly candles, news flow, hollidays. to get a sense of Liquidty.. Also time of day is important on smaller time frames..
You can not force your timeframe on the market... You must Adapt to changing conditions..
Here is an example.....
I remember u/j stuck at 1.02 for 8 months! so the only way to make money interday is to use a smaller time frame...
Once u/j broke 1.02 8 month consolidation.. It started making huge moves! you want to ramp it up to a bigger time frame at this point.
Good traders can sense a bigger move is coming! They also know when market is queit and to use the smaller time frames.
.
Attached Image (click to enlarge)
The only system that will work is one designed by and for yourself.
Never Force your timeframe onto the market! Here is why.. Liquidty changes in the market... So choosing a timeframe is tricky.. Look at Daily, weekly candles to get a sense of Liquidty.. Also time of day is important on smaller time frames.. You can not force your timeframe on the market... You must Adapt to changing conditions.. Here is an example..... I remember u/j stuck at 1.02 for 8 months! so the only way to make money interday is to use a smaller time frame... Once u/j broke 1.02 8 month consolidation.. It started making huge moves! you want...
Price action trading really is as it says; the action of price.
Most people on here focus solely on a chart but don't actually understand the true context behind price
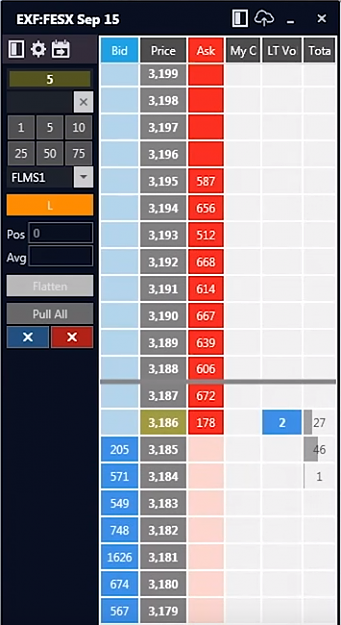
This is what's called a price ladder. It's the core of any financial market. This picture shows the Eurostoxx back from October 2015. We have the asset price in the middle, with Bid (Buy/Long) orders on the left and Ask (Sell / Short / Offer) orders on the right. These are lots. So for example, at 3181 there were 1,626 lots hitting the Bid. At 3195, there were 587 lots hitting the offer.
Attached Image (click to enlarge)
Markets are simply made up of these orders all over the place. If you were to stretch this out to go from, say, 1900 to 3800, then there would be these limit orders sat at all the different prices up and down the scale. I use those prices as 1900 was around the low of September 2011 and 3800 was around the high of April 2015.
So moving back a little, our price charts show us the history of price, correct?
Now I accept that price action principles are fractal, meaning they work in a similar way on a M5 to chart as they do on a Weekly chart. But they are just a representation, and really the market is made up of all these orders placed around the market. When the market moves to a certain price, those orders are executed.
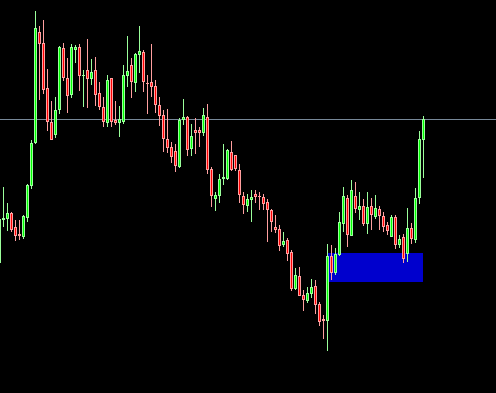
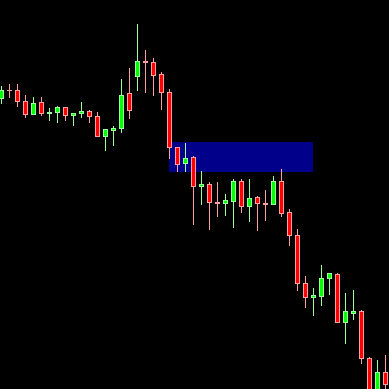
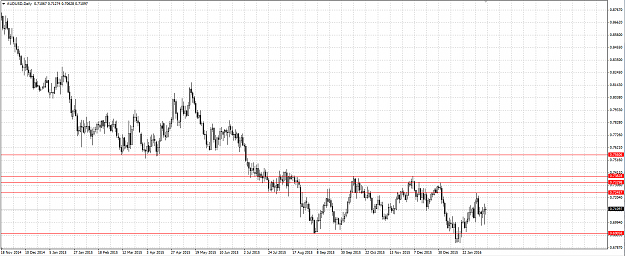
What these traders / investors are looking for with these orders is value. They want to either Buy or Sell their asset at value. Let's look at a practical example of AUDUSD. A little background, and some pure technical traders would shoot me for this, but I always combine technicals with fundamentals. The RBA for the AUD maintain an easing bias. They eased their monetary policy in 2015 and their bias still remains. That means I am short AUD. The Fed for the USD maintain a tightening bias. They've recently hiked, and said there's more to come. So I'm overall bearish AUD/USD, the same as most large investors and some longer term traders will be. Simple economics.
Attached Image (click to enlarge)
By looking at this Daily chart of AUD/USD, I can now predict where a lot of these large limit orders will be sat on the Offer (offer as I am wanting to sell). Remember we said traders and investors want value. So we know where we are looking to do business. The resistance line at 73828 was created, and then we came right back up to it again, before falling back to eventually the lows on the screen. We can predict this, with huge probability, due to everything coming together. And understanding the fact that a market is made up of all these orders sat at different prices, and the idea of "price action" is simply just a representation of the action of price, in our case in the form of a chart.
{quote} 1. If you have access to DOM you would see EURUSD and GBPUSD has their own book. So each is different and not directly related. 2. As for a few major market participants having the control on the markets, seek the reports on which banks have the highest market share in fx. http://www.unich.it/~vitale/Rime-2.pdfhttp://www.brandeis.edu/departments/...ndeis_WP48.pdf
Ignored
I am sorry but you really just don't get it. The two order books you mention both have one common denominator which is the USD so you will find anyone who wants to fill a large transaction for USD will use all the order books.
The second part of your post might be correct, but does it give you information to trade off? No. Banks have far greater access to information than anyone in the retail crowd. You might like to believe that you are trading with them and maybe you are at times but do you know this with absolute certainty?
Price action trading really is as it says; the action of price. Most people on here focus solely on a chart but don't actually understand the true context behind price This is what's called a price ladder. It's the core of any financial market. This picture shows the Eurostoxx back from October 2015. We have the asset price in the middle, with Bid (Buy/Long) orders on the left and Ask (Sell / Short / Offer) orders on the right. These are lots. So for example, at 3181 there were 1,626 lots hitting the Bid. At 3195, there were 587 lots hitting the...
Ignored
I also used to fill a chart with support/resistance lines until I tried a little experiment. Heres what I did so you can try it yourself.
Select a random instrument absolutely anything will do.
Blank out all the price and bar information so you are unable to see any activity of price.
Switch to a different timeframe from the one you started with e.g daily so you have no idea what the chart looks like.
Draw in a handful of random support/resistance lines.
Change chart settings so that you are now able to see price data.
Review how well price has respected your randomly drawn support/resistance lines.
Bask in your own brilliance, at how you were correctly able to draw support/resistance whilst blind from price data.
Here is a video of when I recreated the experiment myself.
Inserted Video
If I had the time I was going code up a quick random number generator to increase the randomness of support & resistance levels, but I really don't think its necessary for the purpose of the demonstration. Perhaps using my 5 year old daughter would have also been more random.
I would recommend trying this experiment for yourself, to rule out that I cheated in some kind of way, so that you can see the results for yourself.
{quote} I am sorry but you really just don't get it. The two order books you mention both have one common denominator which is the USD so you will find anyone who wants to fill a large transaction for USD will use all the order books. The second part of your post might be correct, but does it give you information to trade off? No. Banks have far greater access to information than anyone in the retail crowd. You might like to believe that you are trading with them and maybe you are at times but do you know this with absolute certainty?
Ignored
I do understand what you are saying. My point is if you look at EBS(usually the reference for fx price), you move EURUSD right away if you take the liquidity in EURUSD book and you move GBPUSD right away by taking liquidity from the GBPUSD book. If you put a limit order in EURUSD you can't expect it to come out in GBPUSD or USDJPY. Other common denominator pairs do have a relationship but it is not the kind that you are implying. In short, the currency pair itself can be thought of as a single unit, an instrument that is bought or sold. You really don't have to complicate your trading by thinking that trading on one currency pair will affect another simply because the way the books are structured. Crosses are different, buying EUR/JPY is equivalent to buying the EUR/USD currency pair and simultaneously buying the USD/JPY.
In the global sense they are interconnected but if you want to trade the market right now they are not. Take correlation, does it exists? Yes, but not all the time. Sometimes they do diverge.
{quote} I also used to fill a chart with support/resistance lines until I tried a little experiment. Heres what I did so you can try it yourself. Select a random instrument absolutely anything will do. Blank out all the price and bar information so you are unable to see any activity of price. Switch to a different timeframe from the one you started with e.g daily so you have no idea what the chart looks like. Draw in a handful of random support/resistance lines. Change chart settings so that you are now able to see price data. Review how well price...
Ignored
@redbaron1981
Maybe by doing this you can say oh look that kind of hit this random line I drew, so did this bit. That's just ridiculous though. The idea of the support and resistance, as I explained above, is to find those value areas. Those areas where price has moved away from where it "should be" to a different price. And as you'll notice, it's key swing points. There are many areas that you could say well that's kind of a support area or kind of a resistance area.
All these levels are doing is showing us a price where there "MAY" be some orders that will be relevant. Major levels are important and they do have an impact on trading. It's a fact.
{quote} I do understand what you are saying. My point is if you look at EBS(usually the reference for fx price), you move EURUSD right away if you take the liquidity in EURUSD book and you move GBPUSD right away by taking liquidity from the GBPUSD book. If you put a limit order in EURUSD you can't expect it to come out in GBPUSD or USDJPY. Other common denominator pairs do have a relationship but it is not the kind that you are implying. In short, the currency pair itself can be thought of as a single unit, an instrument that is bought or sold....
Ignored
Unfortunately I was not posting in this thread in expectation of receiving help in trading. Instead I was posting here to clear up what has become the misuse of the word 'price action'. The description I presented of price action was clear and concise and I feel needs no more explaining.
Since you seem to know so much, then I will you to your own 'beliefs' about the market.
On another note since you know so much about the market, please don't PM me again asking me to watch you trade so I can invest funds with you. If what you know about trading is so good then you should not really be looking for funding.