{quote} A complex correction is when PA is making smaller swings within a NSH/NSL and HL/LH larger swing. Look at post 15797 (gray boxes) and 15934 (oval). These are examples.
Ignored
I just needed to characterize them in my own words in order to be able to see and understand them in the future on my own.
{quote} I got it!!! Did i tell you that you are great??and the help you r offering is priceless?? ..anyway,back to the question. So one thing that we should look for in order to find if a level(support/resistance)will hold or not is the number of failed attempts.for example if we have a level of resistance-lets say- and the bulls hit one,two, three,... times and are rejected is an indication (there is a high probability) that this level is strong and the market will reverse. Could you name other things that you are paying attention to in order to...
Ignored
A lot of that will be covered in next week's lesson so be patient with me. I know you are all anxious to trade but we have just started and already your trading should be light years better then before and much better then the indicator community. I will tell you that support and resistance as well as supply and demand are only as strong as how many times its held previous attacks, how strong price has rejected it in the past and what does the current attack look like? These are all important factors that we will cover but I don't want to get off topic. Surgeons must read lots of books and practice in many labs before he gets to cut anyone.
{quote} All credit goes to you, Thank you !! Not sure if I am getting lucky for couple of times but win is win Could you please clarify one thing in the pic. Will you buy at some bullish evidence in the marked are as - The major expectation in bullish -in short term it will make a NSH and the previous major support has been tested thrice Regards Hoved EDIT - Couple of minutes later sold there {image} {image}
Ignored
Hard to say, it would depend more on the order flow. Price should not have corrected so deep. I would need more information.
{quote} Mr. Pip, thank you for the new video and your guidance. I still have a question. How do you define whether there is a complex correction or not? Is it that the price is ranging around the HL/LH area without a clear decision in which direction it wants to go?
Ignored
Look at the chart I posted earlier I will post it here again. Can you see the main swing and how price is range bound between that high and low? Those swing in between that high and low make up a complex correction. Look at the video again, it will help you. If this is something that we are struggling with as a whole let me know and I will see how I can address this. Speak up it's important that you all understand complex corrections.
Thanks for another excellent video, Mr. Pip! I enjoyed watching it last night after looking forward to doing so for most of the evening. What I learned influenced me in taking this EUR/USD long, although I'm feeling nervous about it despite seeing bullish strength-- I think because the momentum on the main swing is reduced somewhat in comparison to what we were seeing before, and it seems that price would want to make a deeper correction before it moves to a NSH, if in fact it does so. Nevertheless, I saw an opportunity so I took it. Any thoughts?
|
Membership Revoked
|
Joined Jul 2010
|9,273 Posts
Traders,
This is part of the reason why I did not want to start covering entries yet. We are losing focus. If you can be responsible with the information I provide, I will have to be more restrictive with releasing it. We are focusing on trades but not on the lesson and studying corrections and complex corrections.
I know trading is the reason we are here and believe me we will be there soon. I don't mind you posting trades around the concept of structure analysis and expectations but all of the questions I have read today have to do with things we have not covered yet and because of the video that I put out yesterday.
We are dealing with structure analysis and expectations not support and resistance, supply and demand, or trade management. You are making it difficult for me and yourselves. Do we understand?
I need to make sure we can identify complex corrections and have the proper expectation. This is my priority right now. We have one more day before we move on to order flow and I want to see your work.
Thanks for another excellent video, Mr. Pip! I enjoyed watching it last night after looking forward to doing so for most of the evening. What I learned influenced me in taking this EUR/USD long, although I'm feeling nervous about it despite seeing bullish strength-- I think because the momentum on the main swing is reduced somewhat in comparison to what we were seeing before, and it seems that price would want to make a deeper correction before it moves to a NSH, if in fact it does so. Nevertheless, I saw an opportunity so I took it. Any thoughts?...
Ignored
You are using the short term to help you come to your expectation. Very good, you appear to be in a complex correction but you are overall very bullish and price is expected to make a NSH.
{quote} Look at the chart I posted earlier I will post it here again. Can you see the main swing and how price is range bound between that high and low? Those swing in between that high and low make up a complex correction. Look at the video again, it will help you. If this is something that we are struggling with as a whole let me know and I will see how I can address this. Speak up it's important that you all understand complex corrections.
Ignored
Thank you, I think I understand. This blue area looks like the start of a complex correction. Do I see it right?
Traders, This is part of the reason why I did not want to start covering entries yet. We are losing focus. If you can be responsible with the information I provide, I will have to be more restrictive with releasing it. We are focusing on trades but not on the lesson and studying corrections and complex corrections. I know trading is the reason we are here and believe me we will be there soon. I don't mind you posting trades around the concept of structure analysis and expectations but all of the questions I have read today have to do with things...
Ignored
Damian, firstly I think it would be good for the newer participants to this thread, who are struggling with the concept of complex pull-backs, that you address this.
Secondly, Traders, do yourselves a favour, follow Mr Pip step by step. Trading will come. But do as he says, if you want to post trades around the current topic all well and good.
Take it one step at a time. The more we as traders post on the current topic being discussed, the more Mr Pip can help us cement what is right, and put us right if we are wrong.
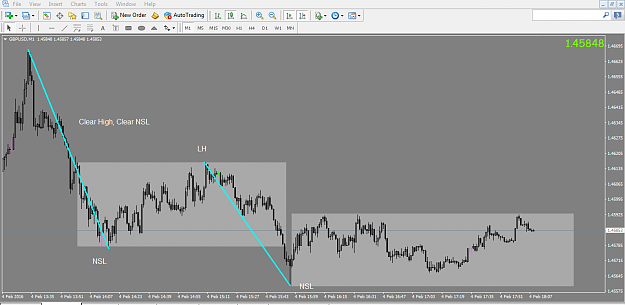
Short term order flow. Cable We have a clear High that price is coming from to form a NSL. Our expectation is for a LH. All the price action in the grey area is short term order flow, which in itself will be made of NSH, HL, and so on. Until the blue trend line is broken to the upside, our expectation is for a LH, followed by a NSL. {image}
Ignored
Good explanation Aj1
--
Mr. Pip, thanks for your latest video, overall really good content but I have some thoughts. Maybe we shouldn't learn how to take trades using structure analysis yet since it's very easy to get carried away and think that we are marathon runners when in fact we just learned how to crawl. The video in itself is very good but maybe this should be implemented when you teach how the puzzle is pieced together? So as you stated above, we should still mark structure and studying complex corrections etc.
I hope my point came across and that I don't sound ungrateful because nothing could be further from the truth, Im truly grateful!
Looking forward to your next lesson!
{quote} Good explanation Aj1 -- Mr. Pip, thanks for your latest video, overall really good content but I have some thoughts. Maybe we shouldn't learn how to take trades using structure analysis yet since it's very easy to get carried away and think that we are marathon runners when in fact we just learned how to crawl. The video in itself is very good but maybe this should be implemented when you teach how the puzzle is pieced together? So as you stated above, we should still mark structure and studying complex corrections etc. I hope...
Ignored
Not at all, you are absolutely correct! It was probably a mistake on my part but what is done is done and we need to get back on track. Thank you for your comment!
Short term order flow. Cable We have a clear High that price is coming from to form a NSL. Our expectation is for a LH. All the price action in the grey area is short term order flow, which in itself will be made of NSH, HL, and so on. Until the blue trend line is broken to the upside, our expectation is for a LH, followed by a NSL. {image}
Short term order flow. Cable We have a clear High that price is coming from to form a NSL. Our expectation is for a LH. All the price action in the grey area is short term order flow, which in itself will be made of NSH, HL, and so on. Until the blue trend line is broken to the upside, our expectation is for a LH, followed by a NSL. {image}
Ignored
Does it not matter that the price and is (according to the chart) above the horizontal line?
{quote} Does it not matter that the price and is (according to the chart) above the horizontal line?
Ignored
No it does not too much. What you have to understand with complex corrections is that the longer that price stays within that process the weaker the expectation becomes. In this particular case the chances of that NSL have severely weakened.
Ivenhad a family emergency today so.not been able to concentrate and read postings etc and look at charts....will be busy friday too so will catch up over the weekend
Ivenhad a family emergency today so.not been able to concentrate and read postings etc and look at charts....will be busy friday too so will catch up over the weekend