{quote} Clive, What are stochastic parameters that you would suggest: a) low/high or close/close b) simple, exponential, smoothed? Thank you.
Ignored
Its worth trying a few settings out on each pair or indice to see which fits best but generally I would use 8,3,3 low/high,simple fixed min 0,fixed max 100..
But thats just me trial and error is the best way ...
clivepackham, You say in the first post of this thread, " ****Just to let you know theres been some changes made to this strategy so please read this post first but then feel free to jump to page 416 post 8309 http://www.forexfactory.com/showthre...835#post845883 5 where the current version resides." Well, when I go to post 8309, I don't see any clear instructions on this new version, or any indicators that you are using. Am I just not seeing it? I would like to learn the new version. Should I just read the thread all the way...
Ignored
Hi Janna,
Welcome.
While you are waiting for Clive, some suggested posts. Clive's recent update Post 9732, post on entries 8353.
List of indicators 8891, downloads for indicators 8898, 8899, 9001.
There are many other great posts by Clive and other members well worth reading. Enjoy.
Hope the above suggested posts will be of help to you.
Good Trading.
Could this possibly work on a 1 hr, 4hr or a daily setup? Would there need to be changes ? Thanks.
Ignored
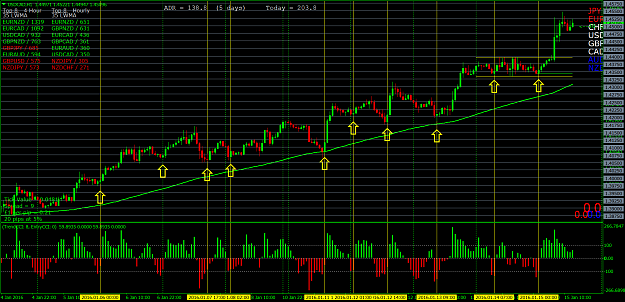
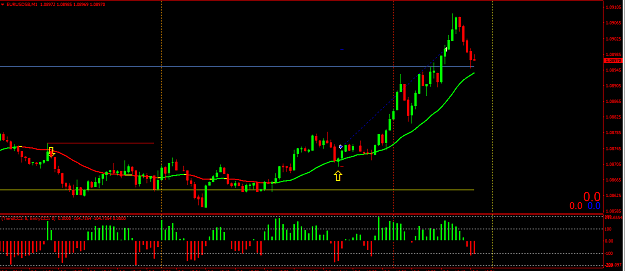
Yes it will work very well on all timeframes heres an hourly for example...
Attached Image (click to enlarge)
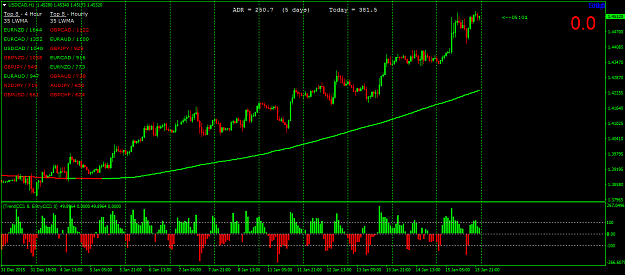
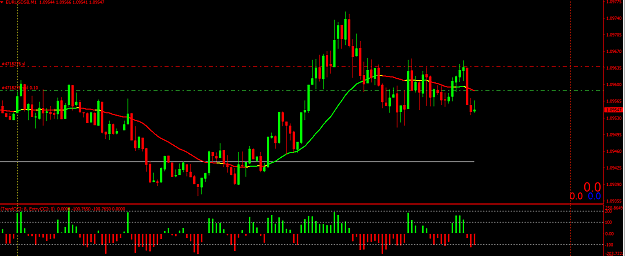
And a top trender usdcad
Attached Image (click to enlarge)
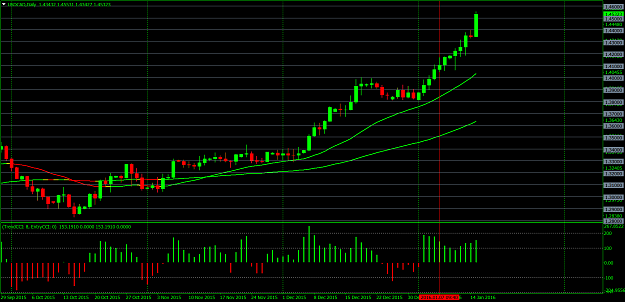
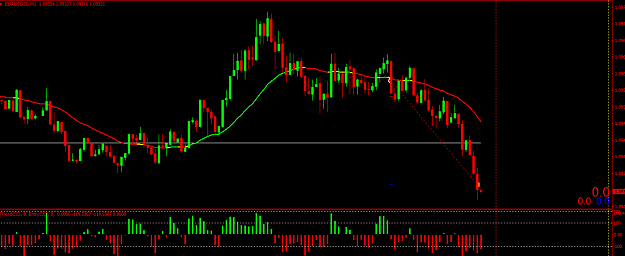
And a nice daily top trender
Attached Image (click to enlarge)
Thing is to just try out different settings on TTindy and see what sort of charts it brings up and find some nice looking strong trending charts to trade . Thats the only way, trial and error ...
{quote} Hi Janna, Welcome. While you are waiting for Clive, some suggested posts. Clive's recent update Post 9732, post on entries 8353. List of indicators 8891, downloads for indicators 8898, 8899, 9001. There are many other great posts by Clive and other members well worth reading. Enjoy. Hope the above suggested posts will be of help to you. Good Trading.
Ignored
Thanks Thomond appreciate your help and to be honest I think guys have just gotta have a bit of a read through and pick out the bits they like...
{quote} Yes it will work very well on all timeframes heres an hourly for example... {image} And a top trender usdcad {image} And a nice daily top trender {image} Thing is to just try out different settings on TTindy and see what sort of charts it brings up and find some nice looking strong trending charts to trade . Thats the only way, trial and error ...
Ignored
Clive, I apologize but I actually used to follow your thread constantly during the TMA days but I am a bit lost on this current setup. I understand the concept of trading but running into an issue with my chart not matching yours. On the example you posted of "USDCAD H1" on post 9763 (second chart), my "USDCAD H1" 35 ma line does not match yours. I understand you would like me to use trial and error settings but I wanted to start of with a baseline before I go on my quest
I also noticed that my TTindy does not match either. Am I missing a setting? Thanks in advance.
{image} {quote} Clive, I apologize but I actually used to follow your thread constantly during the TMA days but I am a bit lost on this current setup. I understand the concept of trading but running into an issue with my chart not matching yours. On the example you posted of "USDCAD H1" on post 9763 (second chart), my "USDCAD H1" 35 ma line does not match yours. I understand you would like me to use trial and error settings but I wanted to start of with a baseline before I go on my quest I also noticed that my TTindy does not match either. Am...
Ignored
Looks to me like you're using a 175 simple MA I use LWMAs......
As for the TTindy I have no idea why yours is different from mine but I'd guess you have a different look back period or something but to be honest the actual settings are not that crucial. There is no magic number that makes one right and another wrong as long as you are looking back a relative period then you should be fine. Use 20 its as good as anything...
The best thing is to understand my simple philosophy about trading and not to get too involved in trying to find a precise setting that works as maybe brokers make a difference???? So heres my philosophy, try to understand it then you will be able to mess around with the settings all day long to your hearts desire, until you start to produce charts that are pleasing to the eye and look easy to trade as then you will have the right setting for that timeframe, that pair and your broker...
The philosophy is simple......
Price can only go up or down, so find a pair that is clearly going one way or the other ie trending strongly, then trade it until the trend ends...
We find that strong trending pair by measuring the slope of a moving average, it can be a simple, exponential , smooth, Linear weighted whatever rocks your boat...It doesn't matter as its the steepness of the slope we are after , the steeper the slope the stronger the trend. Its that simple..
All the previous mentioned MAs will have steep slopes in a strong trend so it matters little which one you use. Now decide how far you want to look back, and again think about what you are trying to achieve , do you want to measure the last 5 minutes on a 5 minute chart, would 1 hour be any good on a 1 hour chart???? How many hours would you like to look back to get a feel for the trend, on 5 min charts, on 15 min charts on 4 hour charts?????
Experiment , change the settings then look at the charts it produces ,are they strong trends, are they tradable??? Put two MAs on your chart one from the current timeframe and one from the timeframe above ,35lwma is as good as any, are they separating nicely? Are they going the same way etc etc , are the CCI signals working 70% of the time??? If so then your settings are ok....
Remember the whole idea is to find strong trending pairs to trade ....Do your settings do that??? If not change them until they do...
You will learn so much more from doing it yourself than me giving you precise instructions, step by step...I've never believed in learning something parrot fashion with no understanding of the theory behind it...so roll up your sleeves open up some charts and play with the TTindy settings to your hearts content until you start to produce the charts you want to trade.
Experiment with the CCI periods too, some pairs are more volatile than others so a larger period like 14 or 20 might fit that pair better, than a less volatile pair that needs the sensitivity of the 8 period CCI....
I change and experiment all the time because I'm constantly looking for the "perfect" settings myself and if you have read the whole thread you will know that I have chopped and changed all the way through seeking the Holy Grail of trading that will guarantee my success but unfortunately up to now I haven't found it, but maybe tomorrow???? Who knows but I will just keep looking ...
Trading is a funny old game and you really have to find something that suits your personality and the way you think, because in the heat of the battle you have to react to the ever changing market conditions in front of you at that time and react accordingly...You won't have time to read through a set of instructions as to the best setting for this or that..
So there you go my friend I'm afraid the secret to trading is not gonna be handed to you on a plate or anyone else for that matter. It takes years of practice and hard work to get it right but when you do, the rewards are almost unlimited..
Also by the way have you got a good strategy tester that you can use to practice your trading skills on anytime of the day you want to??? If not I recommend you get one and again play with it to your hearts content any time of the day or night that suits your lifestyle..
I hope you realise I'm not having a go at you or trying to fob you off with some lame excuse rather than help you.. I hope you realise this is the best way I know to answer your questions to help you the most...
So go find those strong trends my friend and practice, practice , practice until it works..
what change value i shoud if wnat see 200 sma in top 8 broker indicater extern int hgap = 100; extern int vgap = 20; extern int x = 0; extern int y = 20; extern int fontsize = 8; extern int tf1 = 1; extern int tf2 = 15; extern int tf1malength = 100; extern int tf1matype = 3; extern int tf1maprice = 0; extern int tf1lookback = 15; extern int tf2malength = 100; extern int tf2matype = 3; extern int tf2maprice = 0; extern int tf2lookback = 16; extern bool useatr = false; extern string prefix = ""; extern string suffix = "";
Ignored
Come on guys??? You're kidding me right?????
Maybe its in the name?????
How about TF1MALength means the length of the Ma you want to use???? Therefore you want 200..
How about TF1MATYPE means the type of MA you want to use 0=simple, 1=Exponential 2=Smooth and 3 = Linear weighted.. Therefore you want 0
Seriously guys give me a break, use a little bit of the old grey matter just once in a while.....
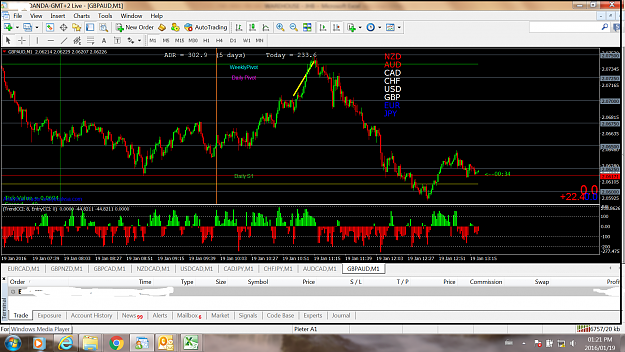
Sir with due respect , i m not kidding one indicater top 8 broker says gbp jpy 15 minute is 267 but orther indicater mn distance shows is 233. In chart i calculate correct is 233 so i ask for coorect setting
Sir with due respect , i m not kidding one indicater top 8 broker says gbp jpy 15 minute is 267 but orther indicater mn distance shows is 233. In chart i calculate correct is 233 so i ask for coorect setting {image} {file}
Ignored
try clicking on clives name and going into his profile and looking under files.Download the .tpl file which are templates and also.indicators.Look at the charts with his templates and then look into the settings and make notesOther way of.doing it.is.click the paper clip.for.list of attachments and going thru same process
Thanks Clive for sharing those words of your father. My father is still alive, but has never been an inspiration in my life. I always envy people who has had or have a father of your father's calibre. May his soul rest in peace. I had an accident recently where before I was super confident in beating this forex game whereas now I find myself filled with self-doubt. I know that the minute doubt creeps in it is game over. I quit my 9 t0 5 job that is how confident I was and now I find myself contemplating going back to a regular job and an ordinary life.
{quote} Its worth trying a few settings out on each pair or indice to see which fits best but generally I would use 8,3,3 low/high,simple fixed min 0,fixed max 100.. But thats just me trial and error is the best way ...
Ignored
@Clivepackham
Clive- many thanks for your earlier comments.
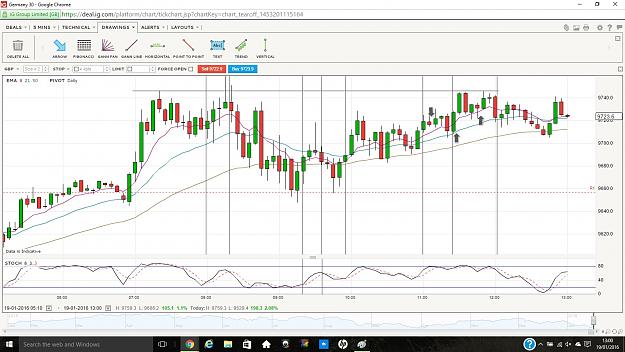
Could I prevail upon you to critique the following chart please.
I am using a 21 ema at the moment. I was experimenting with crosses of the 8 ema in trend with the 21 ema.
However, I have now put in stochastic and using it to show a trade when in line with ema.
Example - I will usually long when 21 ema is pointing up and stoch is at bottom of range and turning up.
Aiming to get targets of ten pips per trade. ( DAX only being traded)
Comment welcome.
Sir with due respect , i m not kidding one indicater top 8 broker says gbp jpy 15 minute is 267 but orther indicater mn distance shows is 233. In chart i calculate correct is 233 so i ask for coorect setting {image} {file}
Ignored
bottom.left corner of your picture...in blue says maprd as in moving average period? 200?If.im right then no wander there is a difference because clive doesnt use 200ma.If you read the thread ....more infact read clives postings it will.show.you.the answer.Correct.me if im wrong pls
{quote} bottom.left corner of your picture...in blue says maprd as in moving average period? 200?if.im right then no wander there is a difference because clive doesnt use 200ma.if you read the thread ....more infact read clives postings it will.show.you.the answer.correct.me if im wrong pls
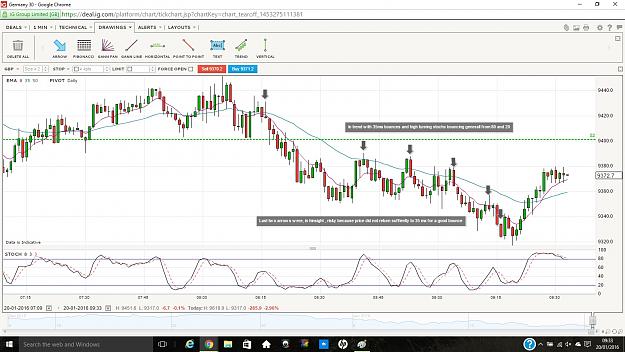
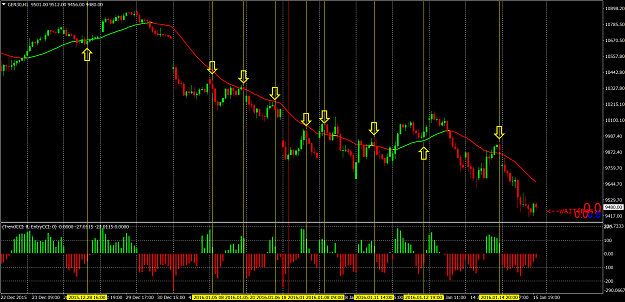
Hope this is okay to post here.
My price, around 8ma bounces a couple of times after first cross of 35 ma for a couple of good trades. Then odds seem to decrease as price continues to feebly bounce toward 35 -Example: the last two arrows are risky/poor trades: 1. More than two bounces or movement of price towards 35ma.
Now price and stochs turn up and price crosses 35ma. Now we wait for price and stochs to turn down then for stchs to rise for a possible long if price curls back to 35ma in preparation to bounce long when stoch turns up from bottom ?
Hope this is okay to post here. My price, around 8ma bounces a couple of times after first cross of 35 ma for a couple of good trades. Then odds seem to decrease as price continues to feebly bounce toward 35 -Example: the last two arrows are risky/poor trades: 1. More than two bounces or movement of price towards 35ma. Now price and stochs turn up and price crosses 35ma. Now we wait for price and stochs to turn down then for stchs to rise for a possible long if price curls back to 35ma in preparation to bounce long when stoch turns up from bottom...
Ignored
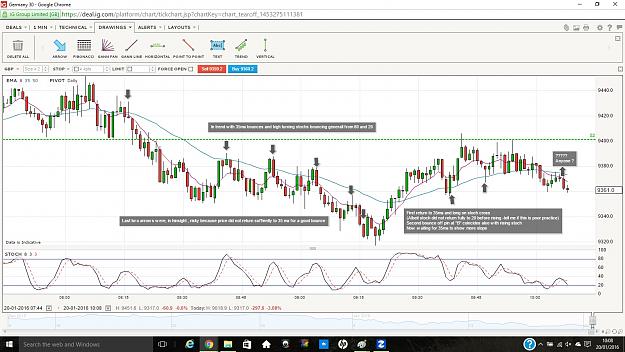
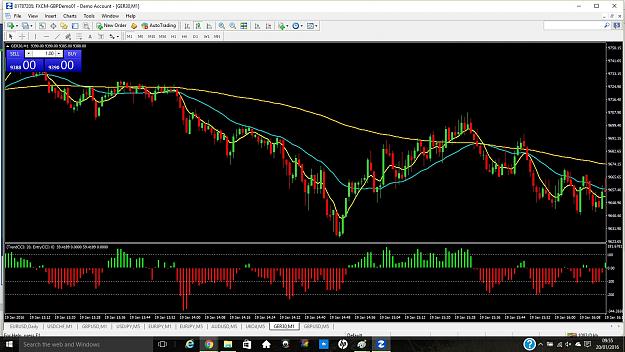
Update on the above.
@Clivepackham
Comments welcome
Clive, you will be pleased to know I have just learnt how to put your cci on MT4 WHICH I SHALL BE USING AFTER THIS POST