i've summarized this strategy from page-1 until page-20 in one book, but still in Ms-Word format.
The purpose is for the new visitor, they can read your strategy in offline mode.
read it in Web page layout as some pictures need big size to understand this system.
Thanks Gemini Man and Abhay, of course; .pdf version attached for the benefit of all. {image}
Ignored
Quixote,
Actually i'm able to convert it to pdf version, but the problem is, same as your upload pdf, some pictures will be cut and can not be seen fullly, that's why i upload in the Word version, with the Webpage layout format (don not change to print page layout, you will get a cut pictures).
{quote} Quixote, Actually i'm able to convert it to pdf version, but the problem is, same as your upload pdf, some pictures will be cut and can not be seen fullly, that's why i upload in the Word version, with the Webpage layout format (don not change to print page layout, you will get a cut pictures). anywy, tx.
Ignored
Yes, as I now realise, Quixote by name, etc. Ho, hum
EUR is now @ 1.0625, I am in SELL now until next turning point or for 20-25 pips
Ignored
Hello abhay:
Congratulations on your EURUSD trade. Price is moving in your favor as you predicted.
Can you explain how you trade high impact news events that occur at a turning point ?
For example lets say price is moving up and is at a resistance level at the news and turning point time. So a reversal trade looks imminent. Would you wait until after the news has been reported for some period of time and then say go short on a trend line break or would you just place a short trade before the news event with a wide stop since you expect price to drop ?
And is your trend forecast method astro based also ?
{quote}Can you explain how you trade high impact news events that occur at a turning point ? .......... Would you wait until after the news has been reported for some period of time and then say go short on a trend line break or would you just place a short trade before the news event with a wide stop since you expect price to drop ? And is your trend forecast method astro based also ? Thanks Borg
Ignored
For High impact news, I think using AutoSignals is the best thing because in manual trade you may become hesitant to pull the trigger and get confused and may not have time to react quickly or put stops ... whereas AutoSignals (after Expert Advisor is released) can very well handle this and over last 5-6 months it has netted handsome profits, given that any automated method will loose some and you might be inclined to think that some trades you would have put differently but it is the overall game that matters...
{quote} For High impact news, I think using AutoSignals is the best thing because in manual trade you may become hesitant to pull the trigger and get confused and may not have time to react quickly or put stops ... whereas AutoSignals (after Expert Advisor is released) can very well handle this and over last 5-6 months it has netted handsome profits, given that any automated method will loose some and you might be inclined to think that some trades you would have put differently but it is the overall game that matters... yes Trend Forecast is also...
Ignored
Hello abhay:
So it sounds like AutoSignals would take trades during high impact news events. But how wide would the stops be ?
{quote} Hello abhay: So it sounds like AutoSignals would take trades during high impact news events. But how wide would the stops be ? Thanks Borg
Ignored
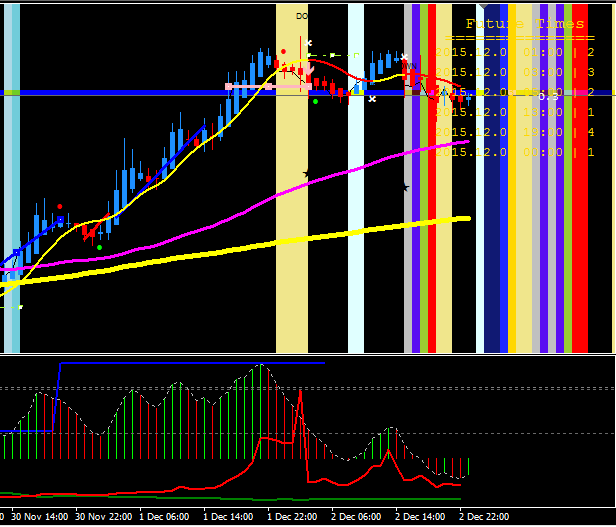
If you see parameters of the indicator, you will see the Stoploss =55 pips but the actual stop can be less than this and that would depend on the Support/Resistance level that indicator calculates before taking the less. So before the high impact news if the range has been small then Stop will be tighter..
The key thing is to do some scrolling back and observe the Blue Line in lower panel to get an idea of how the small losses or the stops are hit and how the profit curve keeps on rising..
I just got this indi activated and want to give it a go. However there a little prob here...
Attached Image (click to enlarge)
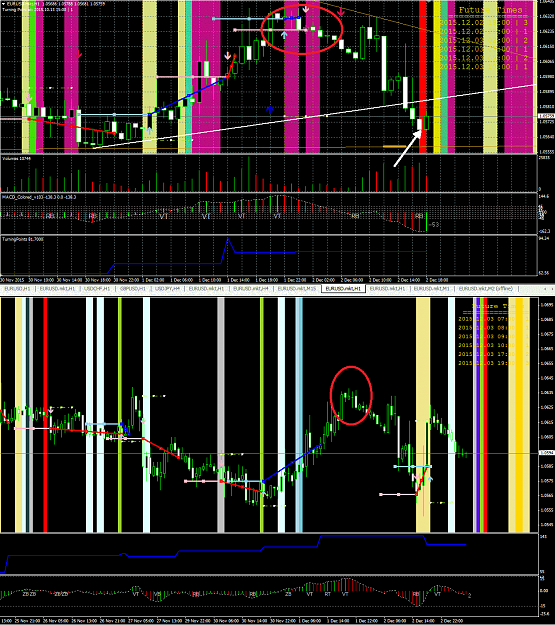
Its seem like my vertical line colour is different from abhay chart. Also, there is missing vertical line compared to previous chart example post by abhay which i circle red.
All in default setting. Although I change the "broker_gmt_time_offset" from 3 to 0 (my broker use GMT0), the line doesn't change.
I'm hoping to get same line as everyone else so in future when we compare or discuss, we have same view.
Its seem like my vertical line colour is different from abhay chart. Also, there is missing vertical line compared to previous chart example post by abhay which i circle red.
Ignored
It is alrite, if you change a parameter config1=true then you will see the missing line. My chart has some additional events that are normally not enabled because they may reduce the profitability over longer period but many times they are quite good. Since in this period there was a huge gap, so I temporarily enabled and it worked very good.
No need to change gmtoffset as it will automatically adjust for your broker. The parameter is in case it is not working and you want to override.
{quote} If you see parameters of the indicator, you will see the Stoploss =55 pips but the actual stop can be less than this and that would depend on the Support/Resistance level that indicator calculates before taking the less. So before the high impact news if the range has been small then Stop will be tighter.. The key thing is to do some scrolling back and observe the Blue Line in lower panel to get an idea of how the small losses or the stops are hit and how the profit curve keeps on rising..
Ignored
Abhay,
Pls pardon my ignorance and appreciate if you can clarify what exactly is 'blue line' suppose to indicate. I.e. what is it intend to do and how to 'read' it ?
Also, I checked few times but the auto signal mode is not giving the signal on a real time basis. The small arrows (signal) appear only after I restart the mt4 platform..
{quote} It is alrite, if you change a parameter config1=true then you will see the missing line. My chart has some additional events that are normally not enabled because they may reduce the profitability over longer period but many times they are quite good. Since in this period there was a huge gap, so I temporarily enabled and it worked very good. No need to change gmtoffset as it will automatically adjust for your broker. The parameter is in case it is not working and you want to override.
Ignored
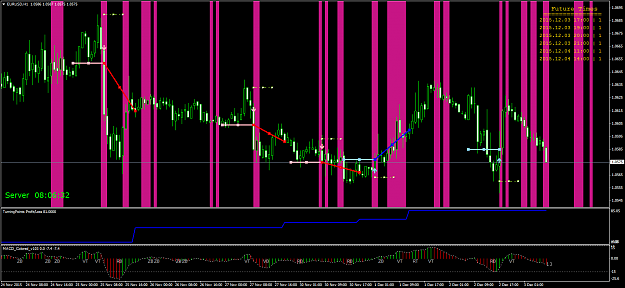
Alright... seem i need to play a little with the setting... After i change config1=true, i got this.
Attached Image (click to enlarge)
All change to 1 colour which, is good for me. I view this vertical zone as same as our traditional support and resistance zone. Will play around with this zone for awhile then i post more what i think about this.
Good day all,
can anyone please confirm if the Euro Dollar one hour candle is presently going down on a dark blue line, i just want to confirm i have the timing right, appreciated