Hello fellow traders,
Hope you had a great weekend, autumn is here and seems that some nice volatility will be available soon. Markets have started to move a little bit at the beginning of a new month, some news event will probably move main currencies a bit which will allow us to see where the markets are heading for the next couple
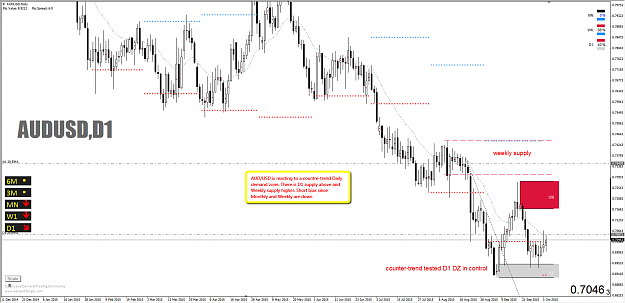
Update on AUD/USD
Hope you had a great weekend, autumn is here and seems that some nice volatility will be available soon. Markets have started to move a little bit at the beginning of a new month, some news event will probably move main currencies a bit which will allow us to see where the markets are heading for the next couple
Update on AUD/USD
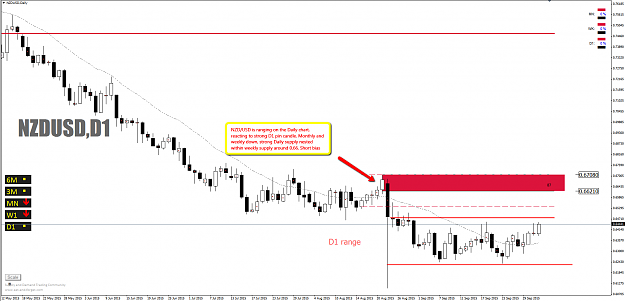
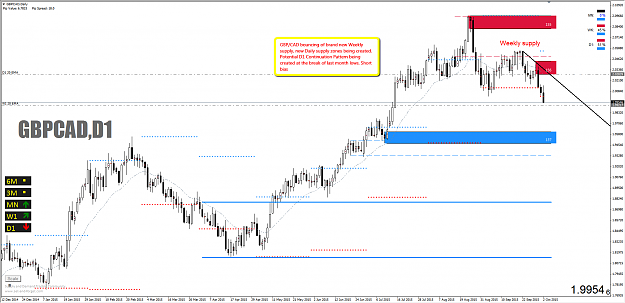
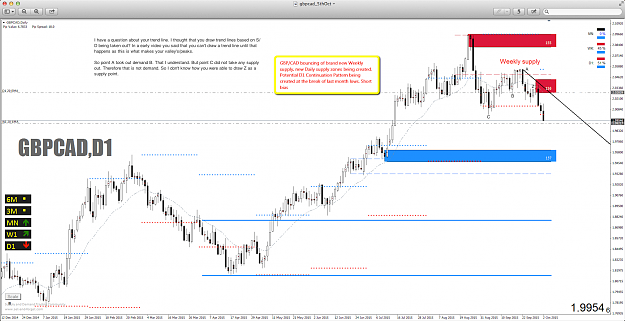
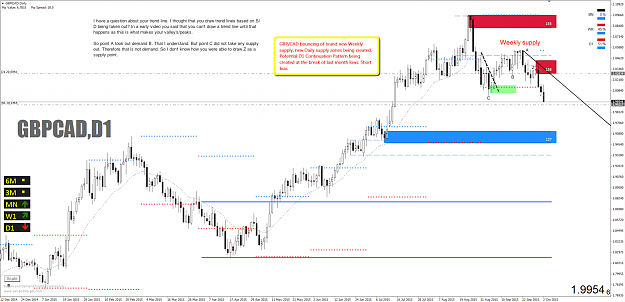
Attached Image (click to enlarge)
Set and Forget supply and demand trading community