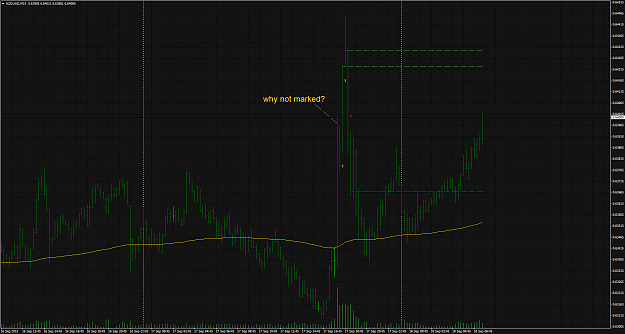
I've coded but still get problems, I can't draw the horizontal line. Also there's some bars that's not draw/count the highest volume as can see the geen circle at the image.
How to draw the horizontal line based on High/Low or Open/Close? How to draw the blue line on Bull candle and the red line on Bear candle?
Attached Image (click to enlarge)
Inserted Code
#property indicator_chart_window
#property indicator_buffers 2
#property indicator_color1 Blue
#property indicator_color2 Red
#property indicator_width1 1
#property indicator_width2 1
#property indicator_style1 0
#property indicator_style2 0

extern int NumberOfBars = 500;
double HighLines[], LowLines[];
//+------------------------------------------------------------------+
//| Custom indicator initialization function                         |
//+------------------------------------------------------------------+
int init()
{
   SetIndexBuffer(0,HighLines);
   SetIndexStyle(0,DRAW_LINE,0,1,indicator_color1);
   SetIndexLabel(0, "HighLines");
   SetIndexEmptyValue(0, EMPTY_VALUE);
   SetIndexBuffer(1,LowLines);
   SetIndexStyle(1,DRAW_LINE,0,1,indicator_color2);
   SetIndexLabel(1, "LowLines");
   SetIndexEmptyValue(1, EMPTY_VALUE);
   IndicatorShortName("SnRV");
   return(0);
}

//+------------------------------------------------------------------+
//| Custom indicator deinitialization function                       |
//+------------------------------------------------------------------+
int deinit()
{
   return(0);
}

//+------------------------------------------------------------------+
//| Custom indicator iteration function                              |
//+------------------------------------------------------------------+
int start()
{
   double HighestVolume;
   int Limit;
   int counted_bars=IndicatorCounted();
   if(counted_bars>0) counted_bars--;
   if ( NumberOfBars == 0 )
   NumberOfBars = Bars-counted_bars;
   Limit=NumberOfBars;
   for(int i=0; i<Limit; i++)
   {
      HighLines[i] = Volume[i];
         {
            HighestVolume = Volume[iHighest(NULL,0,MODE_VOLUME,20,i)];
            if (Volume[i] == HighestVolume)
            {
               HighLines[i]=0;
            }
         }
   }
   return(0);
}
I've coded but still get problems, I can't draw the horizontal line. Also there's some bars that's not draw/count the highest volume as can see the geen circle at the image.
Ignored
pije76-
This should be close to what you want.
If not LMK.
Wow... many many thanks Cyber1! This's what I want...
However I'm still have a questions about the MQL4 language.
- What's the right code to count the highest volume in n period?
- What's the right code to draw the horizontal line based on High or Low or High+Low and Open or Close or Open+Close?
- What's the right code to draw the LimeGreen line if the candle Bull and the Red line if the candle is Bear?
Can you send me the mql4's file please? Or maybe can you explain to me about your code please?
Because I want to learn the MQL4 programming since I'm newbie in the MQL4 and I want to know the logic behind that. So I can edit or create it by myself in the future.
Wow... many many thanks Cyber1! This's what I want... However I'm still have a questions about the MQL4 language. - What's the right code to count the highest volume in n period? - What's the right code to draw the horizontal line based on High or Low or High+Low and Open or Close or Open+Close? - What's the right code to draw the LimeGreen line if the candle Bull and the Red line if the candle is Bear? Can you send me the mql4's file please? Or maybe can you explain to me about your code please? Because I want to learn the MQL4 programming...
Ignored
pije76-
Okay you want to learn, let's see how you do?
If you get stuck let me know.
First, this will only work on H1 timeframe.
We're not going to use any buffers, all the lines and numbers are objects http://docs.mql4.com/objects
then inside your main loop test for Hour = 0
set up another "for loop" length = 24
now populate your array with volume and candle index
while still in the Hour = 0 condition
sort the array
ArraySort(VolAr,WHOLE_ARRAY,0,MODE_DESCEND);
now all the highest volume will be at the beginning of the array
define a function to draw a trend line and the numbers
set up a second "for loop" with the length equal to the number of highs you want to display on the chart with lines etc.
and call the draw trend line function using price and candle index as parameters to draw the trend line
{quote} pije76- Okay you want to learn, let's see how you do? If you get stuck let me know. First, this will only work on H1 timeframe. We're not going to use any buffers, all the lines and numbers are objects http://docs.mql4.com/objects first define a two dimensional array http://docs.mql4.com/array double VolAr[500][2]; then inside your main loop test for Hour = 0 set up another "for loop" length = 24 now populate your array with volume and candle index while still in the Hour = 0 condition sort the array ArraySort(VolAr,WHOLE_ARRAY,0,MODE_DESCEND); now all the highest volume will be at the beginning of the array define a function to draw a trend line and the numbers set up a second "for loop" with the length equal to the number of highs you want to display on the chart with lines etc. and call the draw trend line function using price and candle index as parameters to draw the trend line
Ignored
Hi Cyber1,
I've been tried to write the indicator, but I've stuck with it. I'm a very beginner in the MQL4 programming.
Can you help me which's wrong with my code please?
Inserted Code
#property indicator_chart_window
extern int NumberOfBars = 500;
extern int ControlOfBars = 24;
extern int NumberOfHighs = 3;
extern color UpColor = Blue;
extern color DownColor = Red;
//+------------------------------------------------------------------+
//| Custom indicator initialization function                         |
//+------------------------------------------------------------------+
int init()
{
  return(0);
}

//+------------------------------------------------------------------+
//| Custom indicator deinitialization function                       |
//+------------------------------------------------------------------+
int deinit()
{
  return(0);
}

//+------------------------------------------------------------------+
//| Custom indicator iteration function                              |
//+------------------------------------------------------------------+
int start()
{
  double HighestVolume[NumberOfBars][NumberOfHighs];
  bool BullCandle = true;

  int Limit;
  int counted_bars=IndicatorCounted();
  //---- last counted bar will be recounted
  if(counted_bars>0) counted_bars--; //always count the previous bar
  if ( NumberOfBars == 0 )
  NumberOfBars = Bars-counted_bars;
  Limit=NumberOfBars;
  //Limit=NumberOfBars+1440/Period();

  for(int i=0; i<Limit; i++)
  {
    //Counting highest volume
    HighestVolume = Volume[iHighest(NULL, 0, MODE_VOLUME, ControlOfBars, i)];
    if (Volume[i] == HighestVolume)

    //Filtering the maximum of highest volume
    for(int j=0; j<NumberOfHighs; j++)
    {
      //Sorting highest volume
      ArraySort(HighestVolume, WHOLE_ARRAY, 0, MODE_DESCEND);

      //Drawing lines
      if (iClose(Symbol(), 0, i) - iOpen(Symbol(), 0, i)<0)
      {
        BullCandle=false;
        break;
      }
      if (BullCandle)
      {
        ObjectCreate("UpColor", OBJ_HLINE, 0, UpColor);
        ObjectSet("UpColor", OBJPROP_COLOR, UpColor);
        ObjectSet("UpColor", OBJPROP_STYLE, STYLE_DASHDOT);
        ObjectSet("UpColor", OBJPROP_WIDTH, 1);
      }
      else
      {
        ObjectCreate("DownColor", OBJ_HLINE, 0, DownColor);
        ObjectSet("DownColor", OBJPROP_COLOR, DownColor);
        ObjectSet("DownColor", OBJPROP_STYLE, STYLE_DASHDOT);
        ObjectSet("DownColor", OBJPROP_WIDTH, 1);
      }
    }
  }

  return(0);
}
{quote} Hi Cyber1, I've been tried to write the indicator, but I've stuck with it. I'm a very beginner in the MQL4 programming. Can you help me which's wrong with my code please? #property indicator_chart_window extern int NumberOfBars = 500; extern int ControlOfBars = 24; extern int NumberOfHighs = 3; extern color UpColor = Blue; extern color DownColor = Red; //+------------------------------------------------------------------+ //| Custom indicator initialization function | //+------------------------------------------------------------------+...
Ignored
pije76-
Not a bad attempt - a lot better then others that I have seen.
It will take time and persistence if you want to learn.
If you need further help LMK.
See attached file for comments and how to proceed.
{quote} cyber1 please post mql4 version regarding posted indicator: i have to refresh chart from time to time by changing timeframe to get updated drawn lines.
Ignored
ruma-
I probably will not release it publicly. If the OP gets his coded and he wants to share it thats his choice.
And yes it still needs to have a few things corrected. I wanted to see if it was close to what the OP wanted before spending any more time on it. If I get some time in the next few days I'll work on it.
{quote} ruma- I probably will not release it publicly. If the OP gets his coded and he wants to share it thats his choice. And yes it still needs to have a few things corrected. I wanted to see if it was close to what the OP wanted before spending any more time on it. If I get some time in the next few days I'll work on it.
Ignored
yes there are ...refreshing is one of them, cannot change color, width, style of lines...you don't have to publicly.OP stands for ?
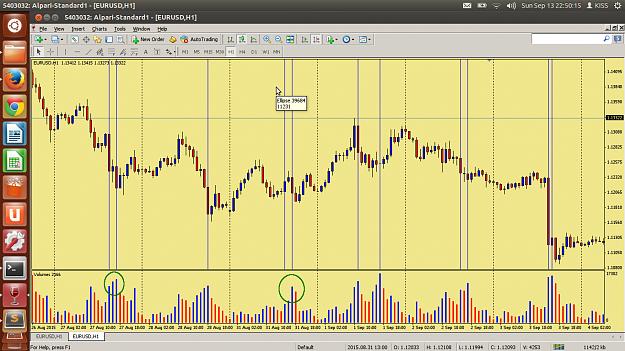
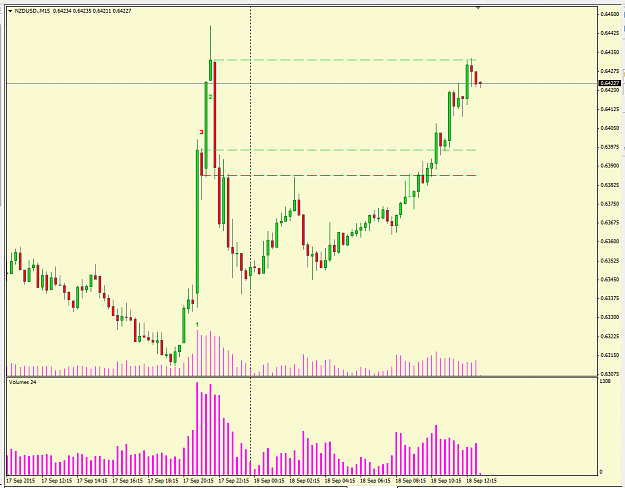
{quote} ruma- I don 't know why it shows that way on NZDUSD M15. Mine does not. It was not designed to work on anything but H1. I'll update that when I get time to work on it. The lines are Dashed so only available in one size. OP = Orignal Poster {image}
Ignored
Thank you for the reply, I was just testing indicator on my own...I appreciate your time and effort. Initially I wanted to change color (I do not use lime on my charts...like to choose colors that don't bother my eyes)...letting other prospective users of indicator to custom appearance as per their preference is not against OP idea and purpose of indicator...Any indicator stand alone is not enough to be a good trader.
No one is taking away your skills and knowledge from you if you share code. With this post my comments on indicator end.
{quote} Thank you for the reply, I was just testing indicator on my own...I appreciate your time and effort. Initially I wanted to change color (I do not use lime on my charts...like to choose colors that don't bother my eyes)...letting other prospective users of indicator to custom appearance as per their preference is not against OP idea and purpose of indicator...Any indicator stand alone is not enough to be a good trader. No one is taking away your skills and knowledge from you if you share code. With this post my comments on indicator end.
Ignored
Cyber1 & Ruma29 -
Yes, I also very appreciate for Cyber1's time and effort to help me to create this indicator.
Ruma29 -
Yes, this indicator can not run stand alone in my strategy. That's why I plan to add some features inside this indicator too.
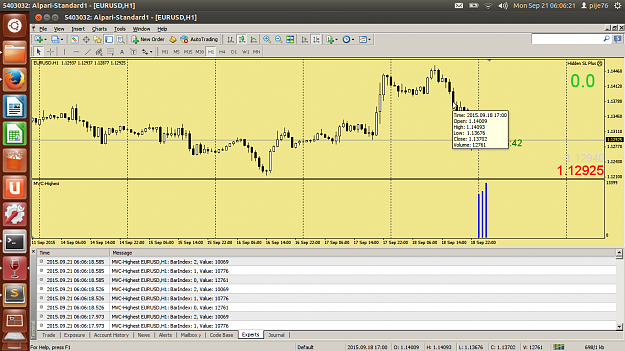
For a moment / 1st step, I want to draw the highest volume on separate window for each day (H1 timeframe only) for learning purpose. And then continue to 2nd step: to draw the horizontal line on the OHLC of candlesticks/bars based on 1st step.
Current condition, I can get the 3 highest volume histogram but it always display that histogram on 3 last histogram only (it's not right position on the right histograms, as we can see on the image that show: Bar index: 0, Volume: 12761).
Attached Image (click to enlarge)
How to draw all of highest volume bars for previous days on the right position?
Here's the latest code:
Inserted Code
//+------------------------------------------------------------------+
//|                                                  MVC-Highest.mq4 |
//|                                          Copyright 2015, pije76. |
//|                               http://www.forexfactory.com/pije76 |
//+------------------------------------------------------------------+
#property copyright "Copyright 2015, pije76"
#property link      "http://www.forexfactory.com/pije76"
#property indicator_separate_window
#property indicator_minimum 0
#property indicator_buffers 1
#property indicator_color1  Blue
#property indicator_width1  2
extern int NumberOfBars = 100;
extern int ControlOfBars = 25;
extern int NumberOfHighs = 3;
//1st step: Define a two dimensional array
double ArrayVolume[];
//double ArrayVolume[][2]; //[i][0] contains the volume index & [i][1] contains the candle index
double iVolume, jVolume, kVolume;
double HighestColor[];
//+------------------------------------------------------------------+
//| Custom indicator initialization function                         |
//+------------------------------------------------------------------+
int init()
{
  SetIndexBuffer(0, HighestColor);
  SetIndexStyle(0, DRAW_HISTOGRAM);
  SetIndexLabel(0, NULL);
  SetIndexEmptyValue(0, 0.0);
  IndicatorShortName("MVC-Highest");
  IndicatorDigits(0);
  //----
  return(0);
}
//+------------------------------------------------------------------+
//| Custom indicator deinitialization function                       |
//+------------------------------------------------------------------+
int deinit()
{
  //----
  return(0);
}
//+------------------------------------------------------------------+
//| Custom indicator iteration function                              |
//+------------------------------------------------------------------+
int start()
{
  double iVolume, jVolume, kVolume;
//  int bulan = 0;
//  int hari = 0;
//  int tahun = 0;
//  string tanggal = "";
//  datetime thisbartime = 0;
  datetime thisbartime[];
//  int shift = 0;
//  int time_frame = 1440;
//  int min = 0;
//  int jam = 0;
//  int thour=0, tmin=0;
  int Limit;
  int counted_bars=IndicatorCounted();
  //---- last counted bar will be recounted
  if(counted_bars>0) counted_bars--; //always count the previous bar
  if ( NumberOfBars == 0 )
  NumberOfBars = Bars-counted_bars;
  Limit=NumberOfBars;
//  bulan=TimeMonth(Time[NumberOfBars]);
//  hari=TimeDay(Time[NumberOfBars]);
//  tahun=TimeYear(Time[NumberOfBars]);
//  min = TimeMinute(Time[NumberOfBars]);
//  jam = TimeHour(Time[NumberOfBars]);
//  tanggal = tahun + "." + bulan + "." + hari + " " + jam + ":" + min;
//  thisbartime = StrToTime(tanggal);
//  shift = iBarShift(NULL,time_frame,thisbartime); //returns the correct shift of the current daily bar
//  thour = TimeHour(iTime(NULL,60,iBarShift(NULL,60,thisbartime)));
//  tmin = TimeMinute(iTime(NULL,Period(),NumberOfBars));
  ArrayCopySeries(thisbartime,MODE_TIME,Symbol(),1440);
  for(int i=0, t=0; i<Limit; i++)
//  for(int i=0; i<Limit; i++)
  {
    //2nd step: Inside main loop, add condition here to check for Hour == 0
    if (Time[i]<thisbartime[t]) t++;
    //if(thour == 0 && tmin == 0)
    {
      ArrayResize(ArrayVolume, Limit, 0);
      //3rd step: Set up another "for loop" length = 24 as there are 24 candles in a day for H1
      for(int j=0; j<ControlOfBars; j++)
      {
        // 4th step: Populate the Array with volume index
        ArrayVolume[j] = Volume[j];
        //ArrayVolume[j] = Volume[j];
        //j++;
      } // end of "j for" loop
    } // end of "if" condition for hour == 0

    //5th step: Sort the Array
    ArraySort(ArrayVolume, WHOLE_ARRAY, 0, MODE_DESCEND);
    //jVolume = ArrayVolume[j];
  }// end of "i for" loop
  //6th step: Define a function to draw a trend line
  //7th step: Set up a second "for loop" with the length equal to the number of highs to display on the chart with lines
    for (int k=0; k<NumberOfHighs; k++)
    {
      //if (ArrayResize(ArrayVolume) > 0) ArraySort(ArrayVolume, WHOLE_ARRAY, 0, MODE_DESCEND);
      //{
        kVolume = ArrayVolume[k];
        //8th step: call the draw trend line function using price and candle index as parameters to draw the trend line
          Print("BarIndex: ", k, ", Value: ", kVolume);
          HighestColor[k]=kVolume;
      //} //end of "if" condition
    }//end of "k for" loop
  return(0);
}
Cyber1 - For a moment / 1st step, I want to draw the highest volume on separate window for each day (H1 timeframe only) for learning purpose. And then continue to 2nd step: to draw the horizontal line on the OHLC of candlesticks/bars based on 1st step. Current condition, I can get the 3 highest volume histogram but it always display that histogram on 3 last histogram only (it's not right position on the right histograms, as we can see on the image that show: Bar index: 0, Volume: 12761). {image} How to draw all of highest volume bars for previous...
Ignored
pije76-
Not bad. You need to define your 2-dimensional array though.
See file for comments
{quote} pije76- Not bad. You need to define your 2-dimensional array though. See file for comments {file}
Ignored
Cyber1 -
Wow, thank you so much Cyber1. I actually don't know how to define the 2D array & the counter inside the cycle.
Now I will continue to 2nd step, to draw horizontal line on the bar chart.
{quote} pije76- Not bad. You need to define your 2-dimensional array though. See file for comments {file}
Ignored
Cyber1 -
I've some questions about the code,
- What's the difference between ArrayResize, ArraySize, ArrayCopy or ArrayCopySeries? Why not to use ArraySize, ArrayCopy or ArrayCopySeries instead of ArrayResize?
- Why use ArrayResize twice at the beginning and the end of code? And why fill the new size for first dimension with zero?