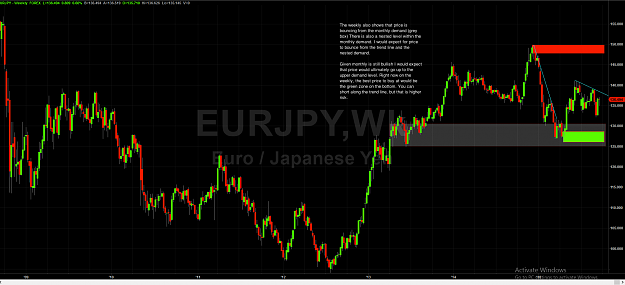
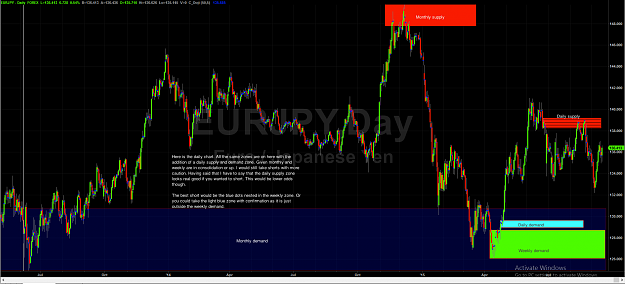
{quote} Ok guys. Here is an example on a HTF. Marks are all on the chart. Is this what Alfonso is trying to teach us? Maybe I am just looking at part of the system or looking at it differently. {image} {image}
Ignored
Though I'm not an expert here, IMHO, your intuition seems to be gradually developing in the right direction Method is really as simple as joining the trend at a pull back and riding it as possible but you are indeed looking at a part of the system and I wouldn't explain your above charts with your exact words either. If you make a complete analysis on multiple time frames with all bells and whistles in place, you'll notice by yourself that you need to rephrase your explanations a bit. As a hint, there is nothing like 'near lows' or 'over there levels' but just valid supply and demand zones which lie on the way of the price, which are whether near or far
{quote} Though I'm not an expert here, IMHO, your intuition seems to be gradually developing in the right direction Method is really as simple as joining the trend at a pull back and riding it as possible but you are indeed looking at a part of the system and I wouldn't explain your above charts with your exact words either. If you make a complete analysis on multiple time frames with all bells and whistles in place, you'll notice by yourself that you need to rephrase your explanations a bit. As a hint, there is nothing like 'near lows' or 'over...
Ignored
Chawl,
Thanks for your explanation. If I could talk to you about the last sentence a little more. The reason I phrased the zones as over there or "near" is because I was unsure as to which zones to be looking at. So you are saying that both locations can be valid? To me the further away ones are just from HTF's. But yet if you look at the chart this way there seems to be little need to use other time frames. I know that is not right either......I'm just not sure as to what to think here.
{quote} Chawl, Thanks for your explanation. If I could talk to you about the last sentence a little more. The reason I phrased the zones as over there or "near" is because I was unsure as to which zones to be looking at. So you are saying that both locations can be valid? To me the further away ones are just from HTF's. But yet if you look at the chart this way there seems to be little need to use other time frames. I know that is not right either......I'm just not sure as to what to think here.
Ignored
I tried to emphasize that it is problematic to categorize levels as near or far ones, sometimes you may need to consider a H4 level for example from 3 years before. In a way you've answered your own question by having doubts. You should indeed be aware of all levels around the current price from all considered time frames, think what 'curve' means. For example if you want to go short on H4 but you are low in daily curve, it means that you are very near to a valid daily demand which may exert a strong buying pressure so you don't want to short sell anything against the face of long buyers. If you look only to H4 but don't know that a daily demand is there in the first place, you'll sure be doomed. This is why Alfonso tirelessly repeats the 'Multiple time frame analysis' motto. I hope I could make my point
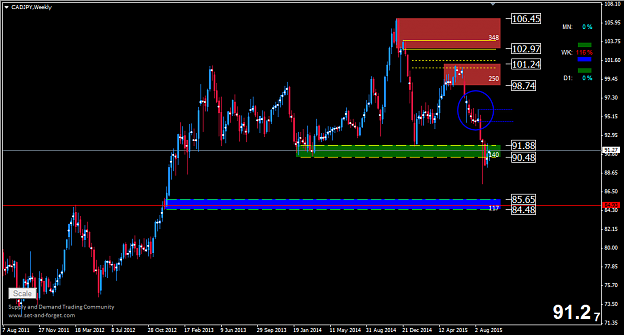
Dear Alfonso Can we consider the blue dashed level is a valid weekly supply !!!!! Please look at the blue circle it contains lots of Cps {image}
Ignored
That is a valid Weekly supply zone on CADJPY Ahmed. It caused the removal of an important demand zone. Only 4 candles at the base, the other 50% basing candles are above the continuation pattern of supply.
Cheers,
Alfonso
Set and Forget supply and demand trading community
Question to the rectangle reader. If old SD gets broken will it not removed automatically or do I need to remove manual. All remaining lines on lower TF make the template full. Is there a pdf?
Ignored
Bernhardt, the rectangle reader only extends the rectangles that you draw with Metatrader's rectangle tool. It will not remove the zones. I could have created such a function but I wanted to see if a zone had been overshot and broken and then decide myself to remove it, otherwise when I looked at my charts I would see that some zones had been gone and I wouldn't know if they had been broken, and that's really important.
Cheers,
Alfonso
Set and Forget supply and demand trading community
{quote} I tried to emphasize that it is problematic to categorize levels as near or far ones, sometimes you may need to consider a H4 level for example from 3 years before. In a way you've answered your own question by having doubts. You should indeed be aware of all levels around the current price from all considered time frames, think what 'curve' means. For example if you want to go short on H4 but you are low in daily curve, it means that you are very near to a valid daily demand which may exert a strong buying pressure so you don't want to...
Ignored
Thanks Chawl. What you wrote here I understand 100%. I just need practice looking at it on charts now.
{quote} That is a valid Weekly supply zone on CADJPY Ahmed. It caused the removal of an important demand zone. Only 4 candles at the base, the other 50% basing candles are above the continuation pattern of supply. Cheers, Alfonso
Ignored
Many thanx Alfonso
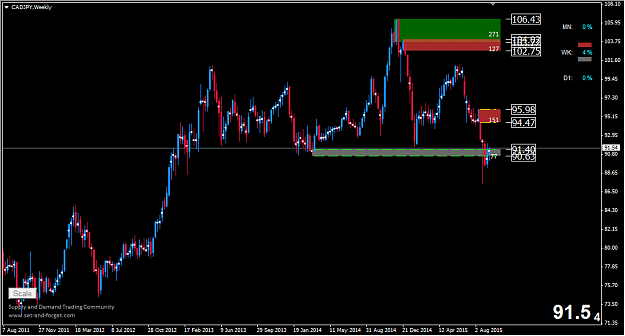
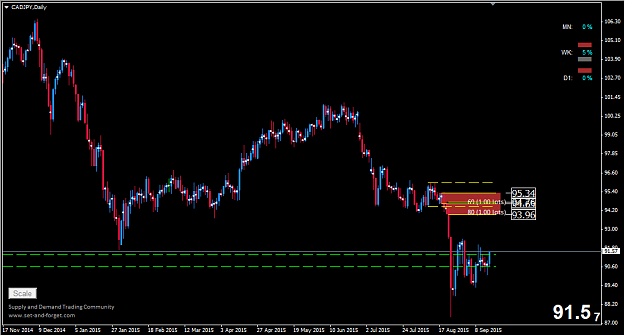
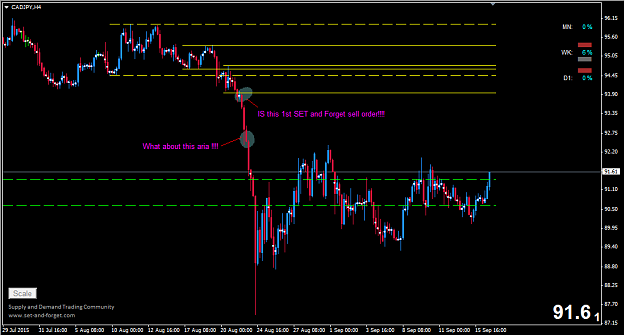
Here is my analysis for the CADJPY (W_D_4Hr) with couple of questions on chart
Weekly is Down , Daily is Down , 4hr ranging but in the Down direction , i will wait with set and forget sell order @ the 1st daily supply zone 93.90
thanks in advance
{quote} Bernhardt, the rectangle reader only extends the rectangles that you draw with Metatrader's rectangle tool. It will not remove the zones. I could have created such a function but I wanted to see if a zone had been overshot and broken and then decide myself to remove it, otherwise when I looked at my charts I would see that some zones had been gone and I wouldn't know if they had been broken, and that's really important. Cheers, Alfonso
Ignored
Thank you that explanes.
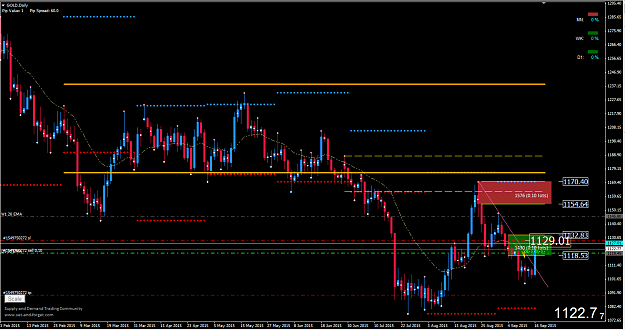
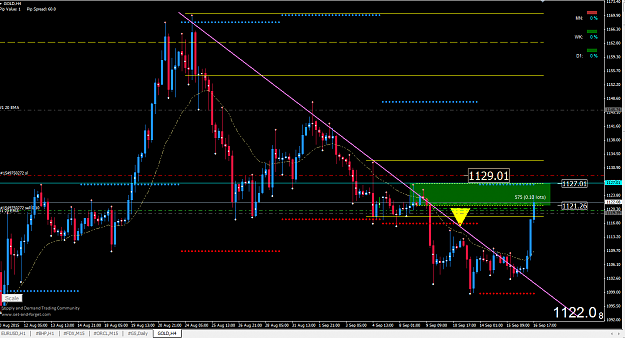
My first "Alfonso"-trade is triggered. It is gold. h4 S is inside of D1. Hope its all correct.
Attached Image(s) (click to enlarge)
Scan all 28 Forex pairs with ONE chart... Currency Strength28 Indicators
{quote} Thank you that explanes. My first "Alfonso"-trade is triggered. It is gold. h4 S is inside of D1. Hope its all correct. {image} {image}
Ignored
That gold short is too aggressive now Bernhard. Why? Monthky demand zone in control in gold. Shorts happened higher because D1 supply had support of weekly supply, it was nested within it. Now that D1/H4 supply is not nested within any bigger timeframe supply and monthly demand again in control, low odds. Hope it works for you though.
Cheers,
Alfonso
Set and Forget supply and demand trading community
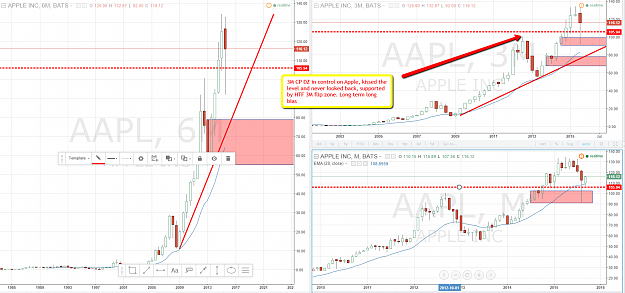
Apple surged higher upon hitting a 3 months demand zone continuation pattern. Price kissed it 3 monthd demand supoorted by a 3 months flip zone, took off and never looked back.
Long bias, similar on other US shares. Cheers,
Alfonso
Attached Image (click to enlarge)
Set and Forget supply and demand trading community
{quote} Many thanx Alfonso Here is my analysis for the CADJPY (W_D_4Hr) with couple of questions on chart Weekly is Down , Daily is Down , 4hr ranging but in the Down direction , i will wait with set and forget sell order @ the 1st daily supply zone 93.90 thanks in advance {image} {image} {image}
Ignored
H4 out of alignment on CAD/JPY Ahmed, you can't take H4 shorts which are not nested within a bigger timeframe that is still in a downtrend. Daily is consolidating, weekly supply higher. Read the rules again, H4 not possible that low).
Don't take small CPs, lean on peaks or you will have many unneccesary losses.
Cheers,
Alfonso
Set and Forget supply and demand trading community
Hey Alfonso. What do you think of this? My apologies about the crudeness of the charts. Tradestation oddly enough does not allow shapes to carry over from chart to chart. So I had to spend 30min creating all the charts over and over again. At first the three time frames confused me. Now I think I might be getting a hang of it. One more post will follow explaining what I mean. What do you think?
Thanks
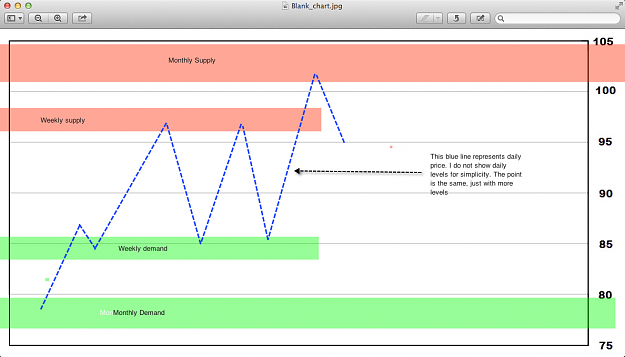
I think I get the multiple time frames Alfonso. Now I understand why you said you can do this with two time frames as well, there is just less opportunities. The reason this is, is because price will bounce from level to level. The entry time frame (daily) will bounce between the weekly levels on its way to the monthly ones. The most secure levels are the nested ones within their HTF levels. So while the daily will go from monthly level to level, you are missing all the PA in the middle while it bounces from weekly levels. Right?
{quote} That gold short is too aggressive now Bernhard. Why? Monthky demand zone in control in gold. Shorts happened higher because D1 supply had support of weekly supply, it was nested within it. Now that D1/H4 supply is not nested within any bigger timeframe supply and monthly demand again in control, low odds. Hope it works for you though. Cheers, Alfonso
Ignored
Thank you for your advice.
Scan all 28 Forex pairs with ONE chart... Currency Strength28 Indicators
Hey Alfonso. What do you think of this? My apologies about the crudeness of the charts. Tradestation oddly enough does not allow shapes to carry over from chart to chart. So I had to spend 30min creating all the charts over and over again. At first the three time frames confused me. Now I think I might be getting a hang of it. One more post will follow explaining what I mean. What do you think? Thanks {image} {image} {image}
Ignored
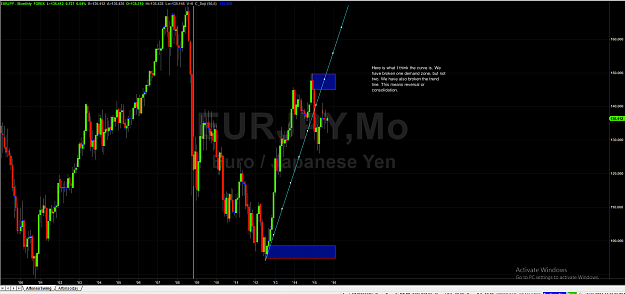
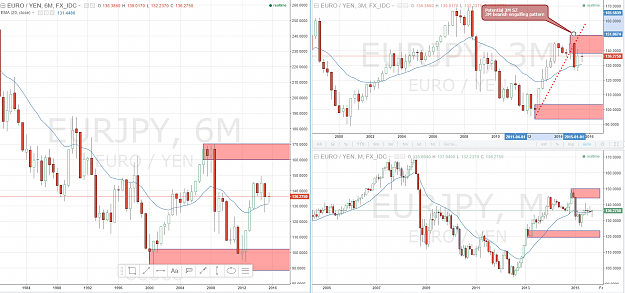
Your curve on the Monthly chart is correct. Your analysis makes sense.
See where we are now on the 3 months chart. Trade Station doesn't have the 3/6 months feature. If you are only trading Forex, a Metatrader broker could help you with your analysis because you'd benefit from the rectangle indicator tools and intuitive tools that have been developped for metatrader.
See my EUR/JPY 6 and 3 months analysis and see where we are now.
Cheers,
Alfonso
Attached Image (click to enlarge)
Set and Forget supply and demand trading community
I think I get the multiple time frames Alfonso. Now I understand why you said you can do this with two time frames as well, there is just less opportunities. The reason this is, is because price will bounce from level to level. The entry time frame (daily) will bounce between the weekly levels on its way to the monthly ones. The most secure levels are the nested ones within their HTF levels. So while the daily will go from monthly level to level, you are missing all the PA in the middle while it bounces from weekly levels. Right? {image}
Ignored
Nested levels are indeed very powerful IF the trend is clear. Those are momentum and location type of trades, highest odds!
Cheers,
Alfonso
Set and Forget supply and demand trading community
{quote} Your curve on the Monthly chart is correct. Your analysis makes sense. See where we are now on the 3 months chart. Trade Station doesn't have the 3/6 months feature. If you are only trading Forex, a Metatrader broker could help you with your analysis because you'd benefit from the rectangle indicator tools and intuitive tools that have been developped for metatrader. See my EUR/JPY 6 and 3 months analysis and see where we are now. Cheers, Alfonso
Ignored
You are right that there is no 3/6 month charts on Tradestation. I have toyed with the idea of getting a MT4 account. I have two problems though. Because of leverage, regulation, and taxes I actually want to move to futures. I also want to be able to use this analysis on U.S. stocks and ETF's. MT4 would limit me with this. I think I might have to hire a coder at that time to make a code for me that makes this possible. It does make things MUCH faster. For now though my account is too small to worry about that. I am still thinking about MT4 though...I don't know what I am going to do about 3/6 month charts though either.
On your charts we seem to be a little high on the 3/6 month charts. On your 3 month you say "potential" supply. I see we have the trend line broken and demand below. We are just waiting for 1 bar to consolidate away from that big red bar, right? This would make it official?