{quote} Oh god help me with settings Anyway thank you for showing next step masofras
Ignored
is there a formula in excel that uses Pearson correlation to normalize price in a linear fashion.... in other words to line up the currencies in an order of a line so that they cycle....... i'm not a math guy but i do understand that the currencies cycle around all the time on which is strongest and what is weakest etc......if so can that any math be applied to cc ccfp indicator to identify the linear cycling effect..... squaring or normalizing would be the first idea ... if you have an excel formula that would be great
{quote} is there a formula in excel that uses Pearson correlation to normalize price in a linear fashion.... in other words to line up the currencies in an order of a line so that they cycle....... i'm not a math guy but i do understand that the currencies cycle around all the time on which is strongest and what is weakest etc......if so can that any math be applied to cc ccfp indicator to identify the linear cycling effect..... squaring or normalizing would be the first idea ... if you have an excel formula that would be great thanks!
{quote} I am trading this on auto ever since i created SDS and it works great. I do however keep an eye on the slope of the currencies coming out of OBOS area's, it must be strong. Also close before news hit.
Ignored
sorry did I miss here some of your other projects? SDS?
Currency Meter does not trade same way the spaghetti dagoods showed? I support very strongly to follow it as he said I see it the same way.
Scan all 28 Forex pairs with ONE chart... Currency Strength28 Indicators
{quote} power meter 1000% win??? Now I am really wondering how that works. It have only trigger_UseHeatMap1=true trigger_TF_HM1=1440 trade_MIN_HeatMap1=0.5 trigger_use_bidratio=false Adr1tp=10.0 Adr1sl=40.0 Same question for you: did you let it run in automode 24h or only some hours of the day? maybe you can post the trades (left click in journal then safe as detailed report)
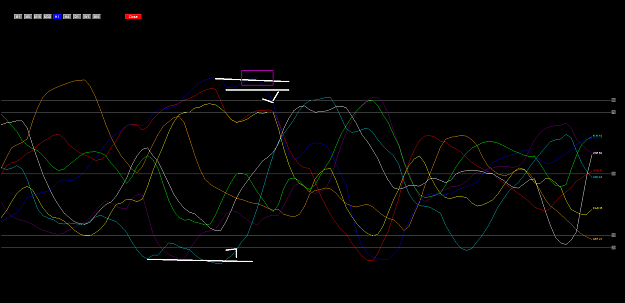
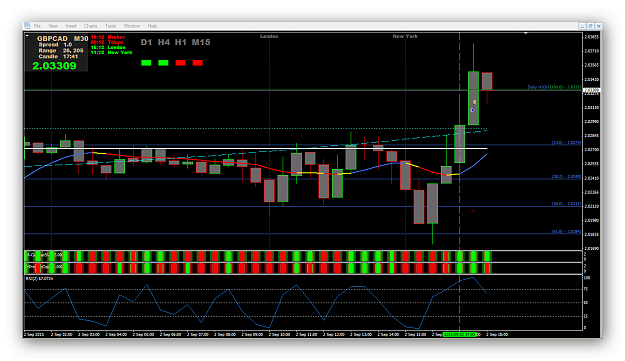
{quote} is this the gap you are talking about? can that gab be seen on chart? what are the dashed lines of RSI? {image}
Ignored
No! Indicator on bottom with dashed lines is nasap's "Range Filter". We usually do not use any charts (just as a reminder) it's only for illustration purpose. I could show naked chart with trades, would it be useful? I guess not really!
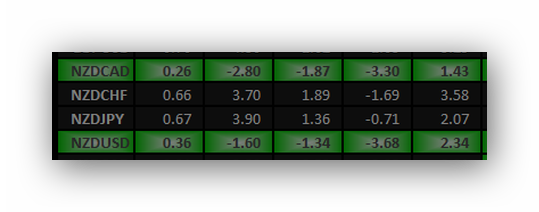
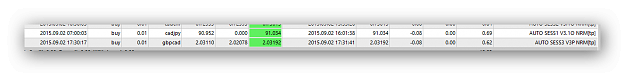
Did you watch the video I've posted a while ago? I guess no since you don't know even what's a GAP (the GAP I am talking about)! Let's have a look on this screen capture:
Attached Image
The columns are
PAIR | BR | RS | BS | LAST BS | <> |
BR, RS, BS was more negative what we easily can see by Last BS. Hence we have a "GAP" (accordingly to the definition of Marialuiza) since the difference of current and last has become positive (very fast even). Both got a BUY signal that's why they are green. On a chart it looks very different, but the GAP - Filter makes it easy to identify such a "turning point" imho.
Jibala
PDF & BCC (Patience Discipline Focus & Belief Confidence Consistency)
I'm thinking how we can use all info we have with all tools made in this thread. Personally, i think only bidratio and gap are useful for have an idea how market is doing. CRS, RS and other info are correlated and don't show different info about market because all are calculate with bidratio as base.
But even with this conclusion, we can try use that superfluos info in other way.
1) CRS can show trend tendence if we smooth result.
2) Bidratio with high/low percent overpass movement can be interested for detect fakeout and weak breakout big movement.
3) Bidratio split in 3 zones can help for pullbacks ( with stoch or rsi as timing support )
4) Mix Bidratio/gap/momentum in same way for give more precise direction in a range of time.
Really i dont know if those options can be usables because things changes when you put that values in chart, but my opinion is bidratio is very good for momentum ( for anticipate or read better what kind of movement have price ) but not good for classic correlation. For that i think better classic MA TF mix because is not affected for price range movement.
We can try simplify dashboard filters. Less filters, less complex to coding because you can cover more variations in that filter. Really we need dash understand when have stop open trades because trend can change. Dash need good filter for that. But that filter dont exist, we need discover new way for get it.
{quote} Bonjour Bernhard, Here it is {file} run in automode 24h? No, only the day and sometimes in the evening automode yes
Ignored
Bonjour mon ami, why did you send all in many pictures? Just the htm-file with one picture as it comes and is safed in any place were you wont it. then zip it together. Or you can try copy the data in a excel file if you can.
Scan all 28 Forex pairs with ONE chart... Currency Strength28 Indicators
when you put bitratio in a chart with max 100 and min 0 and a 50 then you see clearly that it follows the last high and low of the day and the 50 is the middle. if the 50 drops trend is down and contrary. up from the middle of the day (NYO) you can play reversal at 97/3 because those are the last highs and lows and middle price is the 50
Scan all 28 Forex pairs with ONE chart... Currency Strength28 Indicators
{quote} when you put bitratio in a chart with max 100 and min 0 and a 50 then you see clearly that it follows the last high and low of the day and the 50 is the middle. if the 50 drops trend is down and contrary. up from the middle of the day (NYO) you can play reversal at 97/3 because those are the last highs and lows and middle price is the 50
Ignored
You have take care with bidratio reads. Not same when range is 30p than range is 120p. You have different way to trade depending daily range and volatility in that moment. For that i say you need extra filter for get tempo in every bid ratio movement
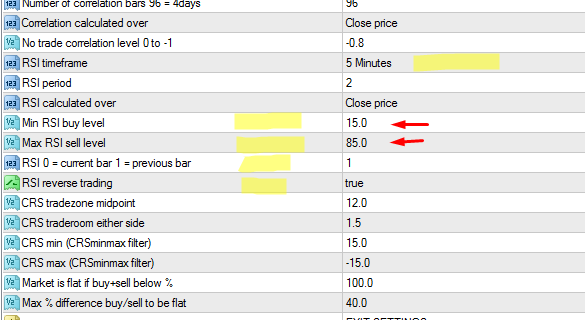
trying for a dash pullback setup. HP please advice if that is correct set.
idea take trend from crs sync or similar
use rsi reverse to get in with pullbacks in small TF (rsi OV)
so if trend is down
sell if m5 or m15 rsi = 80/85 (its pullback)
rsi = 20/15 dont buy (only if trend is up)
Attached Image
Scan all 28 Forex pairs with ONE chart... Currency Strength28 Indicators
Dashboard must just pick the parity to open orders as to me.Then it must open that picked parities charts with template and so everyone can manage their orders with their created systems as I said before.By the way Dash will be less complex.Can we open an option to open the template chart of the parity when signal came.As you know we have template chart option on all the Dashboards.We shall add this option only.
Open template chart automatically when signal comes;true or false
Dashboard must just pick the parity to open orders as to me.Then it must open that picked parities charts with template and so everyone can manage their orders with their created systems as I said before.By the way Dash will be less complex.Can we open an option to open the template chart of the parity when signal came.As you know we have template chart option on all the Dashboards.We shall add this option only. Open template chart automatically when signal comes;true or false
Ignored
And how are you going to manage that if as i have seen happen, 5,6 or 7 signals come at the same time or just in seconds behind each other ?
trying for a dash pullback setup. HP please advice if that is correct set. idea take trend from crs sync or similar use rsi reverse to get in with pullbacks in small TF (rsi OV) so if trend is down sell if m5 or m15 rsi = 80/85 (its pullback) rsi = 20/15 dont buy (only if trend is up) {image}
Ignored
I do not work with RSI trading but your setup seems right to me.
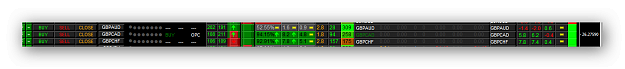
The columns are
PAIR | BR | RS | BS | LAST BS | <> |
Definition of GAP......
Relative strength is based on the difference of all strength's (average all pairs with that currency) of a base currency compared to all strength's (average all pairs with that currency) of the quote currency.
Buy/Sell ratio is based on the difference in the single strength of the base and quote currency of that pair.
So if you say the GAP is the BS and LAST BS it is based on absolute strength's and not relative strength's.
{quote} And how are you going to manage that if as i have seen happen, 5,6 or 7 signals come at the same time or just in seconds behind each other ?
Ignored
We can arrange the conditions of signal isnt it so there wouldnt be a problem.İf one signal had came it would be enough to open the chart.Cant we arrange as just one chart for that condition.
I need to ask HP our coder to make sure dash read the currency strength the same way as this indicator does. I am not sure about it. If dash starts and calculate at the daily candle it will lose all important information of the last day.
Scan all 28 Forex pairs with ONE chart... Currency Strength28 Indicators