• Home
  • Forums
  • Trades
  • News
  • Calendar
  • Market
  • Brokers
  • Login
  • Join
  • User/Email: Password:
  • 12:26am
Menu
  • Forums
  • Trades
  • News
  • Calendar
  • Market
  • Brokers
  • Login
  • Join
  • 12:26am
Sister Sites
  • Metals Mine
  • Energy EXCH
  • Crypto Craft

Options

Bookmark Thread

First Page First Unread Last Page Last Post

Print Thread

Similar Threads

Price movement as a function of Supply and Demand 43 replies

Supply and demand zones and EW principles 1 reply

How Markets Work, in a Nutshell! 32 replies

Supply and Demand Zones 43 replies

Demand and Supply 1 reply

  • Commercial Content
  • /
  • Reply to Thread
  • Subscribe
  • 5,247
Attachments: Supply and demand in a nutshell by Alfonso Moreno
Exit Attachments

Supply and demand in a nutshell by Alfonso Moreno

  • Last Post
  •  
  • 1 303304Page 305306307 486
  • 1 Page 305 486
  •  
  • Post #6,081
  • Quote
  • Edited at 4:45pm Sep 9, 2015 4:23pm | Edited at 4:45pm
  •  John.
  • | Joined May 2015 | Status: Member | 112 Posts
Quoting nathzcinco
Disliked
hi john , when you say don't try to imitate how somebody trades but isn't that what the community is technically doing were copying how alfonso trades and copying his rules , testing them and then trading the rule set .. {quote}
Ignored
Hi nathzcinco, I know that we all are trading here the same rules and this is great! My respect to Alfonso that he shared his ideas and rules with others! I just wanted to explain my mistake - I wanted more trades and I did not want to wait for the trades with highest odds. And I saw that Alfonso took some trades I did not take and I tried to find some other opportunities to trade and break some rules and got losses... Not good! As for me I know that momentum and location trades are highest odds. I tested them not for years but for months. And I know that momentum trades are good but it's very difficult for me to find the highest odds ones. I do not understand the market so good as Alfonso does with momentum and even counter-trend trading. So I want to say that if you know that you do good some things - do these things and test others until you get enough confidence and understanding.
 
 
  • Post #6,082
  • Quote
  • Sep 9, 2015 4:56pm Sep 9, 2015 4:56pm
  •  dvarrin
  • | Joined Aug 2007 | Status: Member | 650 Posts
Hi Alfonso,

I've analysed a price action where price is breaking opposing supply and also the next higher timeframe supply. But during the pullback to the demand zone, price is breaking the up trendline. What is the most important here? Can we take the trade as higher timeframe supply has been taken out or the trendline break is the most important event and we should no more trade long?

Thank you Alfonso for the time you take to answer all my questions!

Cheers,
Daniel
 
 
  • Post #6,083
  • Quote
  • Sep 9, 2015 10:10pm Sep 9, 2015 10:10pm
  •  ahmedalhosenyy
  • | Joined Oct 2006 | Status: Member | 57 Posts
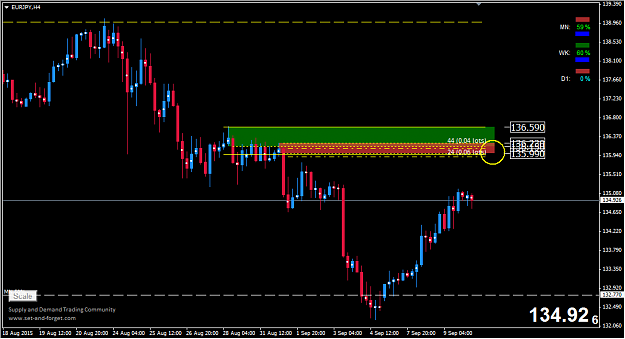
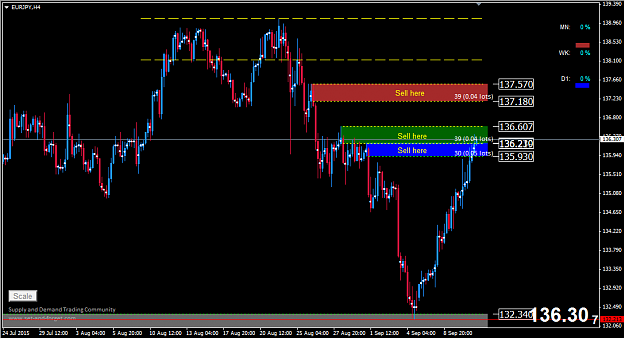
IS It a safe sell using 4hr time frame at the yellow circle aria !!!!
Attached Image (click to enlarge)
Click to Enlarge

Name: sell!!.png
Size: 31 KB
 
 
  • Post #6,084
  • Quote
  • Sep 9, 2015 10:23pm Sep 9, 2015 10:23pm
  •  Nabeelahmad
  • | Joined Jul 2015 | Status: Member | 4 Posts
Hi Alphonso , I am new bie here but from the day i start learning forex iam using your thread on FF. I downloaded your temp but i am not finding the support-resistance lines which i am seeing in you screen.
Can you please put that indicator in thread.
Really helpful thread ...keep it continue.
 
 
  • Post #6,085
  • Quote
  • Sep 10, 2015 1:06am Sep 10, 2015 1:06am
  •  panoramia
  • | Commercial Member | Joined Aug 2011 | 3,525 Posts
Quoting Nabeelahmad
Disliked
Hi Alphonso , I am new bie here but from the day i start learning forex iam using your thread on FF. I downloaded your temp but i am not finding the support-resistance lines which i am seeing in you screen. Can you please put that indicator in thread. Really helpful thread ...keep it continue.
Ignored
Hey there my friend,

Thanks for your post. All the indicators can be downloaded if you follow a link at the first post. Please follow that link and instructions and you will find it. It's included in the indicators package you will download.

Cheers,
Alfonso
Set and Forget supply and demand trading community
 
 
  • Post #6,086
  • Quote
  • Sep 10, 2015 1:06am Sep 10, 2015 1:06am
  •  panoramia
  • | Commercial Member | Joined Aug 2011 | 3,525 Posts
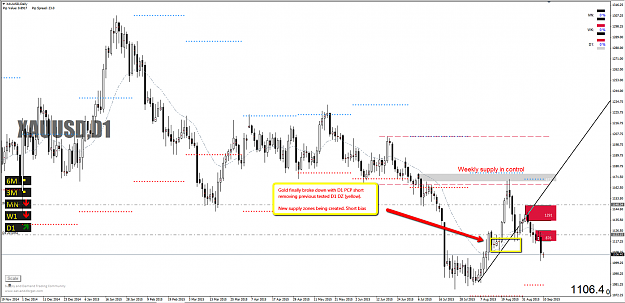
Gold finally broke down with D1 PCP short removing previous tested D1 DZ (yellow).

New supply zones being created. Short bias

Attached Image (click to enlarge)
Click to Enlarge

Name: Screenshot3.png
Size: 390 KB
Set and Forget supply and demand trading community
 
 
  • Post #6,087
  • Quote
  • Sep 10, 2015 1:10am Sep 10, 2015 1:10am
  •  panoramia
  • | Commercial Member | Joined Aug 2011 | 3,525 Posts
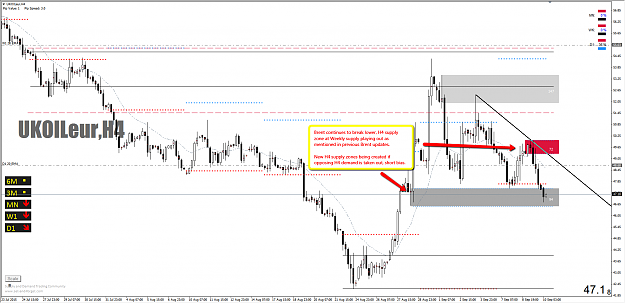
Brent continues to break lower, H4 supply zone at Weekly supply playing out as mentioned in previous Brent updates.

New H4 supply zones being created if opposing H4 demand is taken out, short bias.

Attached Image (click to enlarge)
Click to Enlarge

Name: Screenshot1.png
Size: 110 KB
Set and Forget supply and demand trading community
 
 
  • Post #6,088
  • Quote
  • Sep 10, 2015 1:11am Sep 10, 2015 1:11am
  •  panoramia
  • | Commercial Member | Joined Aug 2011 | 3,525 Posts
Quoting ahmedalhosenyy
Disliked
IS It a safe sell using 4hr time frame at the yellow circle aria !!!! {image}
Ignored
That H4 supply on EURJPY has too many candles at the base, as per the rules it's not valid, confirmation required.
Cheers,
Alfonso
Set and Forget supply and demand trading community
 
 
  • Post #6,089
  • Quote
  • Sep 10, 2015 1:12am Sep 10, 2015 1:12am
  •  panoramia
  • | Commercial Member | Joined Aug 2011 | 3,525 Posts
Quoting dvarrin
Disliked
Hi Alfonso, I've analysed a price action where price is breaking opposing supply and also the next higher timeframe supply. But during the pullback to the demand zone, price is breaking the up trendline. What is the most important here? Can we take the trade as higher timeframe supply has been taken out or the trendline break is the most important event and we should no more trade long? Thank you Alfonso for the time you take to answer all my questions! Cheers, Daniel
Ignored
Rules are very clear about it Daniel. If trendline is broken, we need to wait at demand or lower timeframe's demand nested with 1 at least one timeframe higher demand still trending up.

Cheers,
Alfonso
Set and Forget supply and demand trading community
 
 
  • Post #6,090
  • Quote
  • Sep 10, 2015 1:15am Sep 10, 2015 1:15am
  •  panoramia
  • | Commercial Member | Joined Aug 2011 | 3,525 Posts
Quoting Stockguy
Disliked
{quote} Hey Alfonso. Thanks for all of your replies. They are greatly appreciated for sure. Can you answer the remarks I have on your chart? Thanks, Stockguy {image}
Ignored

I don't really understand your question. Top demand took out opposing supply to the left around 1.4500, then it was tested twice and now broken, so new supply was created (not drawn, around 1.4000).

#1 level is not a reaction to anything to the left, next demand is around 0.9000

Cheers,
Alfonso
Set and Forget supply and demand trading community
 
 
  • Post #6,091
  • Quote
  • Sep 10, 2015 3:31am Sep 10, 2015 3:31am
  •  dvarrin
  • | Joined Aug 2007 | Status: Member | 650 Posts
Quoting panoramia
Disliked
{quote} Rules are very clear about it Daniel. If trendline is broken, we need to wait at demand or lower timeframe's demand nested with 1 at least one timeframe higher demand still trending up. Cheers, Alfonso
Ignored
Thank you Alfonso :-)
 
 
  • Post #6,092
  • Quote
  • Edited at 7:38am Sep 10, 2015 4:02am | Edited at 7:38am
  •  dvarrin
  • | Joined Aug 2007 | Status: Member | 650 Posts
Quoting panoramia
Disliked
{quote} Your monthly chart is incorrect and missing a couple of things... Monthly ascending trendline broken on EURJPY, new monthly supply. Monthly demand zone in control at monthly flip zone Cheers, Alfonso {image}
Ignored
Hi Alfonso,

Why are you drawing the trendline like that? Isn't it a CP pattern where the trendline starts? Shouldn't a trendline connect two W-shape valleys?

Is it possible to send you a private message?

Cheers,
Daniel
 
 
  • Post #6,093
  • Quote
  • Sep 10, 2015 12:32pm Sep 10, 2015 12:32pm
  •  Stockguy
  • | Joined Jul 2015 | Status: Member | 74 Posts
Quoting panoramia
Disliked
{quote} I don't really understand your question. Top demand took out opposing supply to the left around 1.4500, then it was tested twice and now broken, so new supply was created (not drawn, around 1.4000). #1 level is not a reaction to anything to the left, next demand is around 0.9000 Cheers, Alfonso
Ignored
Thanks Alfonso. You answered my question about the test I marked as #1. I guess I thought that was a reaction to the RBR to the left.
Stockguy
 
 
  • Post #6,094
  • Quote
  • Sep 10, 2015 4:10pm Sep 10, 2015 4:10pm
  •  panoramia
  • | Commercial Member | Joined Aug 2011 | 3,525 Posts
Quoting panoramia
Disliked
{quote} Your monthly chart is incorrect and missing a couple of things... Monthly ascending trendline broken on EURJPY, new monthly supply. Monthly demand zone in control at monthly flip zone Cheers, Alfonso {image}
Ignored
I drew that trendline like that because the first point is a drop - base -rally (morning star candlestick pattern).

You can't contact me on private through Forex Factory, you have to send me a private email via www.set-and-forget.com

Cheers,
Alfonso
Set and Forget supply and demand trading community
 
 
  • Post #6,095
  • Quote
  • Sep 10, 2015 4:11pm Sep 10, 2015 4:11pm
  •  panoramia
  • | Commercial Member | Joined Aug 2011 | 3,525 Posts
Quoting Stockguy
Disliked
{quote} Thanks Alfonso. You answered my question about the test I marked as #1. I guess I thought that was a reaction to the RBR to the left. Stockguy
Ignored
Glad to help my friend. Nice to hear you got the idea.

Cheers,
Alfonso
Set and Forget supply and demand trading community
 
 
  • Post #6,096
  • Quote
  • Sep 10, 2015 4:29pm Sep 10, 2015 4:29pm
  •  Stockguy
  • | Joined Jul 2015 | Status: Member | 74 Posts
Ok Alfonso. I just finished watching you video from page 1 all over again. I watched the webinar about picking the right timeframes to trade. Its titled "What time frame combinations to trade. This is back when you were only trading two time frames. I have to say that it kinda eludes me as to why you need a third time frame in the first place? I don't get the middle time frame. So say we are trading the monthly, weekly, and daily. Why do you really need the weekly? Can't you still just use the daily and monthly? Last question. With the monthly chart as the highest time frame how do you know when the trend will end? Sure you can tell the monthly will be in a ...say downtrend, and you can mark the last swing as your curve. But, how do you know those will hold? You can eye shorts based on the monthly. But that does not mean
they will hold. How do you stop yourself from getting caught going up and up time frames endlessly?

Thanks,
Stockguy
 
 
  • Post #6,097
  • Quote
  • Sep 10, 2015 6:04pm Sep 10, 2015 6:04pm
  •  ahmedalhosenyy
  • | Joined Oct 2006 | Status: Member | 57 Posts
Quoting panoramia
Disliked
{quote} That H4 supply on EURJPY has too many candles at the base, as per the rules it's not valid, confirmation required. Cheers, Alfonso
Ignored
HI alfonso
there are three supply levels
1- daily level
2&3 4hrs supply levels nested inside the daily level

isnot that strength the supply level to sell with the trend??

regards
 
 
  • Post #6,098
  • Quote
  • Sep 10, 2015 9:25pm Sep 10, 2015 9:25pm
  •  ahmedalhosenyy
  • | Joined Oct 2006 | Status: Member | 57 Posts
Quoting panoramia
Disliked
Gold finally broke down with D1 PCP short removing previous tested D1 DZ (yellow). New supply zones being created. Short bias {image}
Ignored
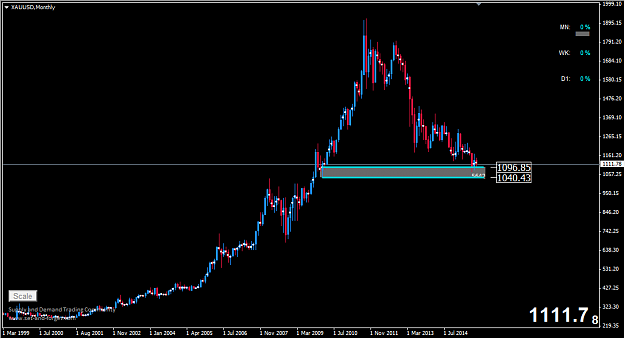
What about the monthly demand zone , could we expect prices bonus little up before continue down !!!!!
Attached Image (click to enlarge)
Click to Enlarge

Name: gold monthly.png
Size: 27 KB
 
 
  • Post #6,099
  • Quote
  • Sep 10, 2015 10:34pm Sep 10, 2015 10:34pm
  •  ahmedalhosenyy
  • | Joined Oct 2006 | Status: Member | 57 Posts
Quoting panoramia
Disliked
Gold finally broke down with D1 PCP short removing previous tested D1 DZ (yellow). New supply zones being created. Short bias {image}
Ignored
another Question about last demand '' In yellow'' why its considered as a demand !!!! it should break the opposite supply to be considered a valid demand which didnot happen ?
 
 
  • Post #6,100
  • Quote
  • Sep 10, 2015 11:51pm Sep 10, 2015 11:51pm
  •  ahmedalhosenyy
  • | Joined Oct 2006 | Status: Member | 57 Posts
EURJPY three opportunities to sell which one !!!

hello alfonso
in the eurjpy there are supply levels were built can we consider the whole three levels a valid sell opportunities !!!!
Attached Image (click to enlarge)
Click to Enlarge

Name: 3 levels.png
Size: 35 KB
 
 
  • Commercial Content
  • /
  • Supply and demand in a nutshell by Alfonso Moreno
  • Reply to Thread
    • 1 303304Page 305306307 486
    • 1 Page 305 486
1 trader viewing now
  • More
Top of Page
Forex Factory Blog Updated: Alerting All Members
  • Facebook
  • Twitter
About FF
  • Mission
  • Products
  • User Guide
  • Media Kit
  • Blog
  • Contact
FF Products
  • Forums
  • Trades
  • Calendar
  • News
  • Market
  • Brokers
  • Trade Explorer
FF Website
  • Homepage
  • Search
  • Members
  • Report a Bug
Follow FF
  • Facebook
  • Twitter

FF Sister Sites:

  • Metals Mine
  • Energy EXCH
  • Crypto Craft

Forex Factory® is a brand of Fair Economy, Inc.

Terms of Service / ©2022