• Home
  • Forums
  • Trades
  • News
  • Calendar
  • Market
  • Brokers
  • Login
  • Join
  • User/Email: Password:
  • 4:24pm
Menu
  • Forums
  • Trades
  • News
  • Calendar
  • Market
  • Brokers
  • Login
  • Join
  • 4:24pm
Sister Sites
  • Metals Mine
  • Energy EXCH
  • Crypto Craft

Options

Bookmark Thread

First Page First Unread Last Page Last Post

Print Thread

Similar Threads

Price movement as a function of Supply and Demand 43 replies

Supply and demand zones and EW principles 1 reply

How Markets Work, in a Nutshell! 32 replies

Supply and Demand Zones 43 replies

Demand and Supply 1 reply

  • Commercial Content
  • /
  • Reply to Thread
  • Subscribe
  • 5,247
Attachments: Supply and demand in a nutshell by Alfonso Moreno
Exit Attachments

Supply and demand in a nutshell by Alfonso Moreno

  • Last Post
  •  
  • 1 302303Page 304305306 486
  • 1 Page 304 486
  •  
  • Post #6,061
  • Quote
  • Sep 9, 2015 2:50am Sep 9, 2015 2:50am
  •  nathzcinco
  • | Joined Aug 2015 | Status: Member | 60 Posts
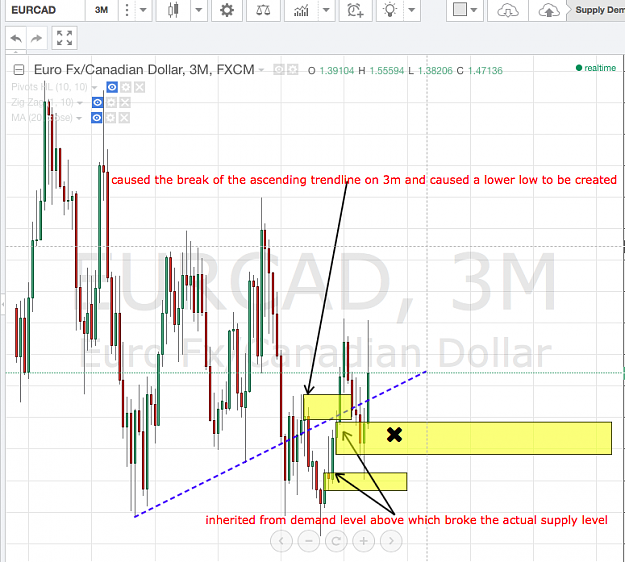
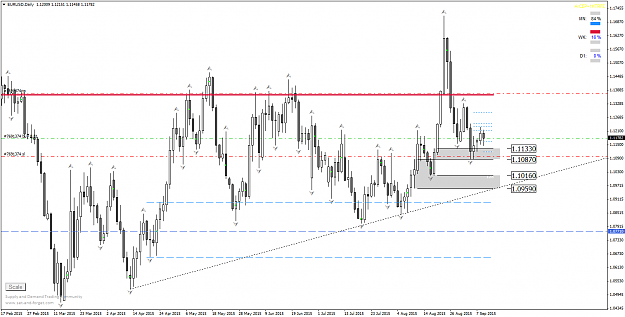
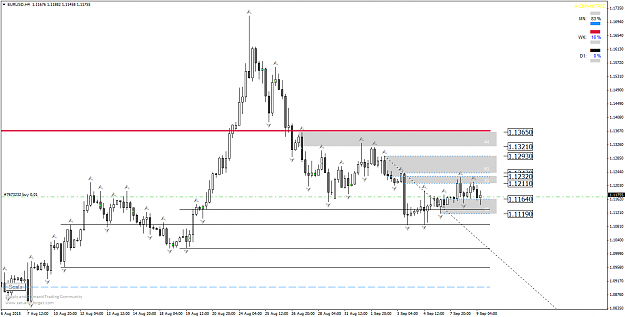
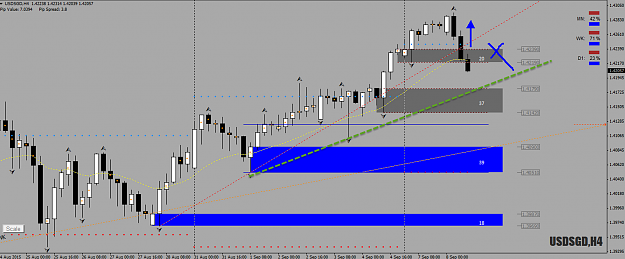
you also had an ascending trend line first vally was the lower demand the next was the demand onto if you look carefully you will see the higher high but it was broken quite quickly like alfonso already stated. but that zone was also a 3M zone which broke the ascending trend line on the 3m but was soon removed as seen on my chart
Quoting Chawl
Disliked
{quote} I think your levels are also true but it seems few are missed including the CP that Alfonso had drawn just because you neglect a flip zone and your chart is missing the trend line analysis. For example at the time of my vertical line, there would be a broken trend line which would be creating two demands on top of each other and your two supplies at the bottom would be supplies even there haven't been a historical low but as they broke the opposing demands. Also if you trace a bit, you can clearly see that when price had made to the lowest...
Ignored
Attached Image (click to enlarge)
Click to Enlarge

Name: Screen Shot 2015-09-09 at 07.47.37.png
Size: 96 KB
 
 
  • Post #6,062
  • Quote
  • Sep 9, 2015 3:02am Sep 9, 2015 3:02am
  •  quieTrader
  • | Joined Oct 2014 | Status: Member | 23 Posts
Hello, traders

I'm new here, and trying to understand the basic rules and so I have a question about breakout TL...

On screen is break TL, Demand zone is so valid, or not ? (sorry my english, I still learning)

I understand that this? :
Quote
Disliked
When a Trendline is broken, the imbalance originally created that caused the break of the TL will be validated automatically as a valid zone even if an opposing level has not been removed

Attached Image (click to enlarge)
Click to Enlarge

Name: AUDUSDH4.png
Size: 49 KB


thank you
English is not my native language
 
 
  • Post #6,063
  • Quote
  • Sep 9, 2015 4:23am Sep 9, 2015 4:23am
  •  dvarrin
  • | Joined Aug 2007 | Status: Member | 650 Posts
My analysis for EURUSD. Any comment about a possible mistake is welcome ;-)

Monthly trend is down:
Attached Image (click to enlarge)
Click to Enlarge

Name: EURUSDMonthly.png
Size: 61 KB


Weekly is consolidating. The down TL has been broken (a bit aggressive, but a less aggressive down TL has also been broken) and price has also retested the zone causing the break of the down TL, but we have to wait for an other valleyto be able to draw an upwards trendline or price to break a second supply zone to confirm the trend is now up.
Attached Image (click to enlarge)
Click to Enlarge

Name: EURUSDWeekly.png
Size: 44 KB


Daily is up. We can draw an upwards trendline. Price has restested a valid demand zone.
Attached Image (click to enlarge)
Click to Enlarge

Name: EURUSDDaily.png
Size: 62 KB


The down trendline has been broken and price retests the zone causing the break of the TL, right at Daily demand proximal line.
There are many supply zones above, but they have all been retested already and this compression could easily be removed.
I think it should go up.
Attached Image (click to enlarge)
Click to Enlarge

Name: EURUSDH4.png
Size: 49 KB


Cheers,
Daniel
 
 
  • Post #6,064
  • Quote
  • Sep 9, 2015 4:44am Sep 9, 2015 4:44am
  •  Baifo
  • | Joined Sep 2015 | Status: Junior Member | 4 Posts
In my opinion weekly eur/usd is not consolidating. It is up.
Attached Image (click to enlarge)
Click to Enlarge

Name: FxPro - MetaTrader 4.png
Size: 90 KB
 
 
  • Post #6,065
  • Quote
  • Sep 9, 2015 4:53am Sep 9, 2015 4:53am
  •  dvarrin
  • | Joined Aug 2007 | Status: Member | 650 Posts
Quoting Baifo
Disliked
In my opinion weekly eur/usd is not consolidating. It is up.{image}
Ignored
Yes, you're right ;-)
 
 
  • Post #6,066
  • Quote
  • Sep 9, 2015 5:18am Sep 9, 2015 5:18am
  •  panoramia
  • | Commercial Member | Joined Aug 2011 | 3,525 Posts
Quoting quieTrader
Disliked
Hello, traders I'm new here, and trying to understand the basic rules and so I have a question about breakout TL... On screen is break TL, Demand zone is so valid, or not ? (sorry my english, I still learning) I understand that this? : {quote} {image} thank you
Ignored
Yes, rules say that. Trendline broken, a new demand zone is created. The question is, that demand will only be tradable IF the multiple timeframe analysis and trend is with you for higher odds.

Cheers,
Alfonso
Set and Forget supply and demand trading community
 
 
  • Post #6,067
  • Quote
  • Sep 9, 2015 5:23am Sep 9, 2015 5:23am
  •  panoramia
  • | Commercial Member | Joined Aug 2011 | 3,525 Posts
Quoting Baifo
Disliked
In my opinion weekly eur/usd is not consolidating. It is up.{image}
Ignored
As per the rules, EUR/SD weekly timeframe is up, a weekly supply has been taken out and an ascending trendline has been created, so weekly is up!
Cheers,
Alfonso
Set and Forget supply and demand trading community
 
 
  • Post #6,068
  • Quote
  • Sep 9, 2015 5:24am Sep 9, 2015 5:24am
  •  panoramia
  • | Commercial Member | Joined Aug 2011 | 3,525 Posts
Quoting dvarrin
Disliked
My analysis for EURUSD. Any comment about a possible mistake is welcome ;-) Monthly trend is down: {image} Weekly is consolidating. The down TL has been broken (a bit aggressive, but a less aggressive down TL has also been broken) and price has also retested the zone causing the break of the down TL, but we have to wait for an other valleyto be able to draw an upwards trendline or price to break a second supply zone to confirm the trend is now up. {image} Daily is up. We can draw an upwards trendline. Price has restested a valid demand zone. {image}...
Ignored
The ascending Daily trendline is incorrect my friend. You did not connect the latest 2 valleys. On the weekly we have an ascending trendline and uptrend on EURUSD.
Cheers,
Alfonso
Set and Forget supply and demand trading community
 
 
  • Post #6,069
  • Quote
  • Sep 9, 2015 5:27am Sep 9, 2015 5:27am
  •  panoramia
  • | Commercial Member | Joined Aug 2011 | 3,525 Posts
Quoting dvarrin
Disliked
{quote} EURJPY is a bit difficult to analyse. For me there is consolidation on the monthly and consolidating or up on the weekly. On the daily, the trend is down, but at the same time on the weekly price is right at a flip zone, with free room on the up side. I don't know if it means that price is in fact in an up trend on the weekly, as it broke above supply, turning it into a flip zone. Probably not safe to trade downwards with the daily trend, against the weekly. But I did the same mistake and took that trade :-( {image} {image} {image} Cheers,...
Ignored
Your monthly chart is incorrect and missing a couple of things...

Monthly ascending trendline broken on EURJPY, new monthly supply. Monthly demand zone in control at monthly flip zone
Cheers,
Alfonso

Attached Image (click to enlarge)
Click to Enlarge

Name: Screenshot1.png
Size: 223 KB
Set and Forget supply and demand trading community
 
 
  • Post #6,070
  • Quote
  • Sep 9, 2015 5:27am Sep 9, 2015 5:27am
  •  dvarrin
  • | Joined Aug 2007 | Status: Member | 650 Posts
Hi Alfonso,

To be able to draw a trendline, we connect to valleys with higher highs and higher low or two peaks with lower lows and lower highs.
For an uptrend, is it enough to have a higher high after the second valley, or it must also break and remove a supply zone?

Cheers,
Daniel
 
 
  • Post #6,071
  • Quote
  • Sep 9, 2015 5:29am Sep 9, 2015 5:29am
  •  panoramia
  • | Commercial Member | Joined Aug 2011 | 3,525 Posts
Quoting John.
Disliked
USDTRY Long H4 - my last chance for today All trends are up, no opposing zone in control. All time highs. {image} {image} {image}
Ignored
That H4 long on USD/TRY was not high odds as per the rules. We had 3 or more continuation patterns of demand, over-extension. Buying on new CPs is low odds, you need to lean on 1 timeframe higher Daily demand for high odds.

Cheers,
Alfonso
Set and Forget supply and demand trading community
 
 
  • Post #6,072
  • Quote
  • Sep 9, 2015 5:30am Sep 9, 2015 5:30am
  •  panoramia
  • | Commercial Member | Joined Aug 2011 | 3,525 Posts
Quoting dvarrin
Disliked
Hi Alfonso, To be able to draw a trendline, we connect to valleys with higher highs and higher low or two peaks with lower lows and lower highs. For an uptrend, is it enough to have a higher high after the second valley, or it must also break and remove a supply zone? Cheers, Daniel
Ignored
Rules say you need trendline + opposing zone taken out for a trend.

Cheers,
Alfonso
Set and Forget supply and demand trading community
 
 
  • Post #6,073
  • Quote
  • Sep 9, 2015 5:34am Sep 9, 2015 5:34am
  •  panoramia
  • | Commercial Member | Joined Aug 2011 | 3,525 Posts
Quoting John.
Disliked
USDSGD H4 Long Momentum LOSS WK/D1/H4 - up* WK/D1 demand in control * I'm not sure that H4 was still up because it was very difficult to draw H4 TL correctly {image} {image} {image}
Ignored
Correct H4 trendline drawn in green (tricky one I must admit). Invalid H4 demand zone, why? Departure was very poor, so low odds. D1 bearish engulf after a strong rally in price, normally price retraces to previous D1 bullish engulf or valid Daily demand. Hope it makes sense. Cheers, Alfonso
Attached Image (click to enlarge)
Click to Enlarge

Name: Screenshot1.png
Size: 358 KB
Set and Forget supply and demand trading community
 
 
  • Post #6,074
  • Quote
  • Sep 9, 2015 6:09am Sep 9, 2015 6:09am
  •  John.
  • | Joined May 2015 | Status: Member | 112 Posts
Thanks Alfonso for commenting my mistakes! I will focus on location and momentum trading on my live account and continue backtesting in FT.
 
 
  • Post #6,075
  • Quote
  • Sep 9, 2015 6:24am Sep 9, 2015 6:24am
  •  dvarrin
  • | Joined Aug 2007 | Status: Member | 650 Posts
Quoting panoramia
Disliked
{quote} Rules say you need trendline + opposing zone taken out for a trend. Cheers, Alfonso
Ignored
But if a demand zone at the first valley is breaking opposing supply and then price pulls back to create a new valley and then breaks above the previous high, without removing an opposing supply zone this time, can we connect the two valleys, even if at the second one there is no demand zone?

Cheers,
Daniel
 
 
  • Post #6,076
  • Quote
  • Sep 9, 2015 7:27am Sep 9, 2015 7:27am
  •  apereiro
  • | Joined Jan 2013 | Status: Member | 7 Posts
Quoting dvarrin
Disliked
{quote} But if a demand zone at the first valley is breaking opposing supply and then price pulls back to create a new valley and then breaks above the previous high, without removing an opposing supply zone this time, can we connect the two valleys, even if at the second one there is no demand zone? Cheers, Daniel
Ignored
Hi Daniel

YouŽll get two valleys and you can draw an ascending TL and a SZ is taken out and youŽll get an uptrend in that period.

Adolfo
 
 
  • Post #6,077
  • Quote
  • Sep 9, 2015 7:37am Sep 9, 2015 7:37am
  •  quieTrader
  • | Joined Oct 2014 | Status: Member | 23 Posts
Quoting panoramia
Disliked
{quote} Yes, rules say that. Trendline broken, a new demand zone is created. The question is, that demand will only be tradable IF the multiple timeframe analysis and trend is with you for higher odds. Cheers, Alfonso
Ignored
Thank you, it make sense.

I did not draw anything else, I just wanted to know if I understood correctly. Thanks for your time. I read over and over again to rule and watch your videos. They give me a sense of more than a thousand indicators. For a long time I was messing around them (indicators and systems), but I understand that this is not the way for me...

Thanks again for your support
English is not my native language
 
 
  • Post #6,078
  • Quote
  • Sep 9, 2015 11:18am Sep 9, 2015 11:18am
  •  Stockguy
  • | Joined Jul 2015 | Status: Member | 74 Posts
Hey Alfonso. If you don't mind can you confirm/correct my idea on this chart.

Thank You.


http://www.forexfactory.com/showthre...38#post8476938
 
 
  • Post #6,079
  • Quote
  • Sep 9, 2015 3:34pm Sep 9, 2015 3:34pm
  •  John.
  • | Joined May 2015 | Status: Member | 112 Posts
Hi! Today was a good trading day and I have recovered all my last losses. I just want to say that it's easy to make mistakes. But you must just follow the rules and never deviate from them. No compromises are allowed. If you break only one smallest rule - and the market will bit you. Do not try to imitate how somebody (Alfonso or somebody else ) is trading. You must do what you know.
 
 
  • Post #6,080
  • Quote
  • Sep 9, 2015 4:10pm Sep 9, 2015 4:10pm
  •  nathzcinco
  • | Joined Aug 2015 | Status: Member | 60 Posts
hi john , when you say don't try to imitate how somebody trades but isn't that what the community is technically doing were copying how alfonso trades and copying his rules , testing them and then trading the rule set ..
Quoting John.
Disliked
Hi! Today was a good trading day and I have recovered all my last losses. I just want to say that it's easy to make mistakes. But you must just follow the rules and never deviate from them. No compromises are allowed. If you break only one smallest rule - and the market will bit you. Do not try to imitate how somebody (Alfonso or somebody else ) is trading. You must do what you know.
Ignored
 
 
  • Commercial Content
  • /
  • Supply and demand in a nutshell by Alfonso Moreno
  • Reply to Thread
    • 1 302303Page 304305306 486
    • 1 Page 304 486
0 traders viewing now
  • More
Top of Page
  • Facebook
  • Twitter
About FF
  • Mission
  • Products
  • User Guide
  • Media Kit
  • Blog
  • Contact
FF Products
  • Forums
  • Trades
  • Calendar
  • News
  • Market
  • Brokers
  • Trade Explorer
FF Website
  • Homepage
  • Search
  • Members
  • Report a Bug
Follow FF
  • Facebook
  • Twitter

FF Sister Sites:

  • Metals Mine
  • Energy EXCH
  • Crypto Craft

Forex Factory® is a brand of Fair Economy, Inc.

Terms of Service / ©2022