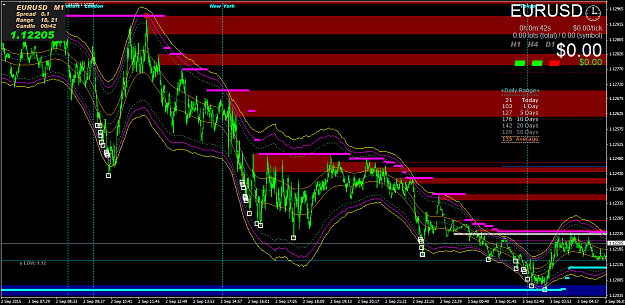
{quote} a little bit more detail on NY............ {image} This is just the basics but I do this for all trading windows that I am interested in trading! Masterrmind........ :nerd:
Ignored
Hey this is masterly work. Amazing to see you did such home work.
{quote} Hey this masterly work. Amazing to see you did such home work.
Ignored
Chart analysis is very important because from that analysis it allows a trader to draw expectations of what is likely to occur in the future.
No trader can be right 100% of the time but every trader can and should be prepared for such deviations.
Apply technical + fundamental harmoniously and that gives you the edge!
As I say a trader should not trade blindly and must be aware of all the possibilities and create an actionable plan that allows for an effective navigation through the treacherous waters of the market!
{quote} Believe it or not but trading this method is still very much in the 'testing' phase albeit live trading from my point of view. I am trading it heavily biased towards the Asian session (since it is well known as a rangy period.... precisely what I want) due to a capacity to 'load up' in lot sizing and an expectation of likely pip ranges. When I trade the pre-FF (GMT 5:00) session I reduce significantly the applied lot sizes. Post NY Open trading is currently being tested too but represents other hidden dangers such as variable trading ranges...
Ignored
Did you draw the magenta lines or is this a TF adjustable indi? Thanks! Jason
{quote} Did you draw the magenta lines or is this a TF adjustable indi? Thanks! Jason
Ignored
Hi Jason,
I drew these magenta colored lines on the chart 'roughly' this time just to provide a basic illustration of some of the things I consider.
I'm sure indicators are available for this purpose but not really necessary.... just mark the high and low of a trading window and apply the MT4 measuring tool to get the pip range.... fairly rough but it is only for a 1st pass look if you know what I mean.
The whole aim is to build up a picture of expectation moving forward.
{quote} Hi Jason, I drew these magenta colored lines on the chart 'roughly' this time just to provide a basic illustration of some of the things I consider. I'm sure indicators are available for this purpose but not really necessary.... just mark the high and low of a trading window and apply the MT4 measuring tool to get the pip range.... fairly rough but it is only for a 1st pass look if you know what I mean. The whole aim is to build up a picture of expectation moving forward. Hope that helps............ Masterrmind............
Ignored
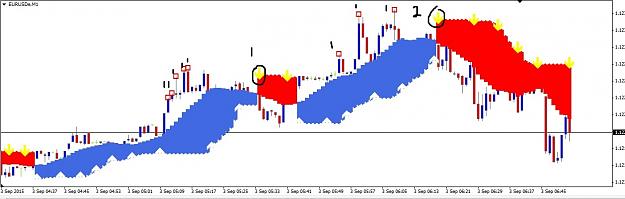
Doing a back testing also helps in understanding how many squares are formed at lows or highs each time when it makes lows / highs in eurusd or gbpusd.
This helps to adjust the lot size based on capital.
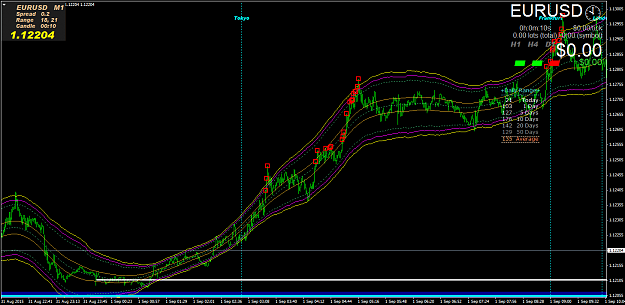
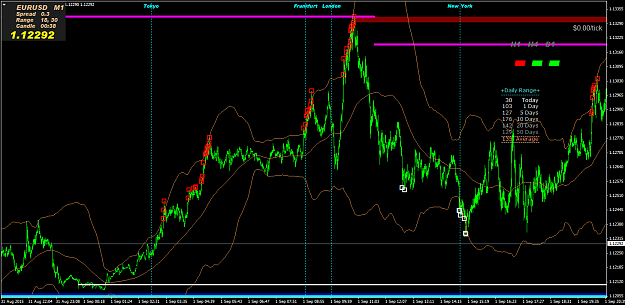
Squares in the outer band can be considered for trades, Inner band need to be ignored. {image} {image}
Ignored
In real time you will have far more squares outside the bands than what you are showing back in history. These bands are great for trading real time but are completely useless to backtest visually.
{quote} In real time you will have far more squares outside the bands than what you are showing back in history. These bands are great for trading real time but are completely useless to backtest visually.
Ignored
Yeah completely agree. But I wanted to have a kind of 'rule" to take trades only in outer band, for which the success rate could be more when compared to taking trades for squares in the Inner band.
One more thing, the EA places trades for all squares, but in real time, manual trading, certain squares can be avoided.
{quote} Great point, showing live results from one person to the other are vastly different. And keep up the good work, you have a great insight on fundementals which will help you in the long run.
Ignored
Well said Mer, and I really appreciate the compliment....
Fundamental Analysis is not a sure thing, but I do my best to interpret other traders expectations/reactions and Act Upon....
Have an INVESTOR Mindset, but Trade like an ENTREPRENEUR
{quote} In real time you will have far more squares outside the bands than what you are showing back in history. These bands are great for trading real time but are completely useless to backtest visually.
Ignored
I see the point, yes, back testing in history shows some squares in the inner band, which were actually on outer band when trades were placed.
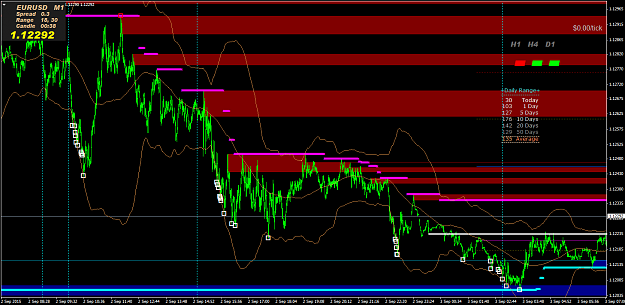
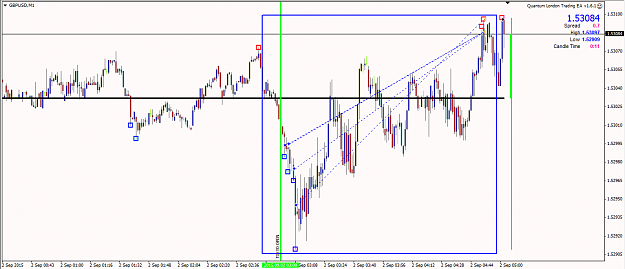
guys i don't get how can this be profitable from the examples shown. The instructions say open a new trade if you see a box of one color and then close when you see one of the other.
In the charts shown on page1 it's blue boxes so these are longs. The 1st trade is already in the -ve because price went below the blue box so it's in the negative and can only be closed when you see a red box. Take this trade that i have uploaded from one of the members here. You see after the 1st trade price went downwards The first trade is in the negative. That's a loss.
guys i don't get how can this be profitable from the examples shown. The instructions say open a new trade if you see a box of one color and then close when you see one of the other. In the charts shown on page1 it's blue boxes so these are longs. The 1st trade is already in the -ve because price went below the blue box so it's in the negative and can only be closed when you see a red box. Take this trade that i have uploaded from one of the members here. You see after the 1st trade price went downwards The first trade is in the negative. That's...
Ignored
On your example, all entries were close at a profit ...