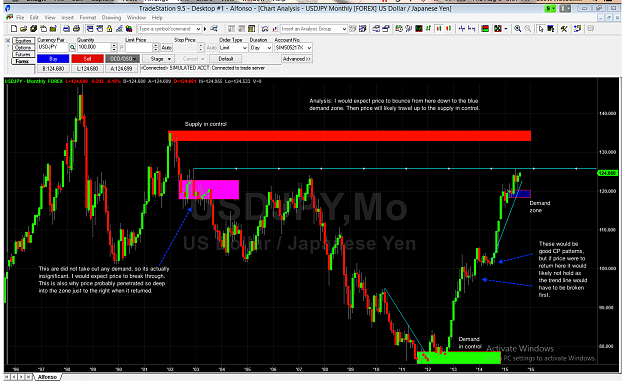
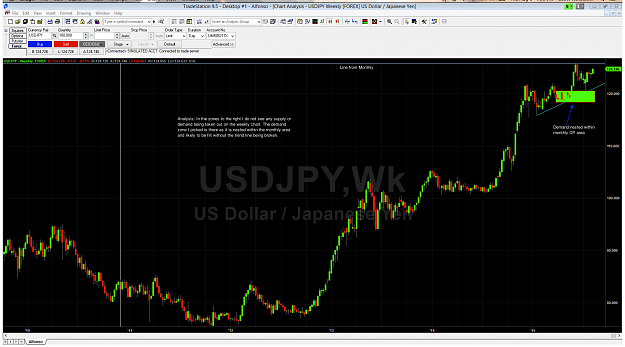
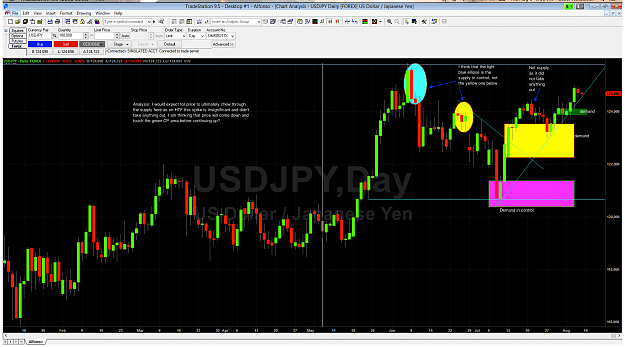
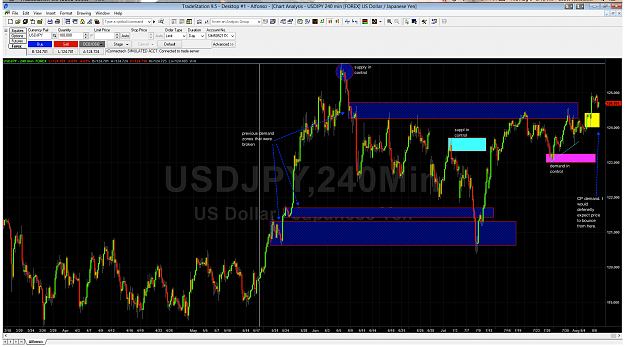
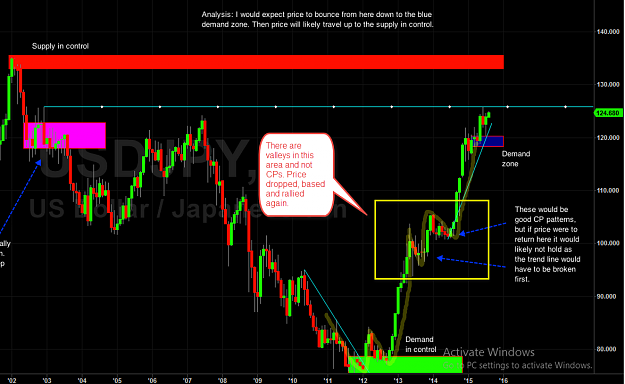
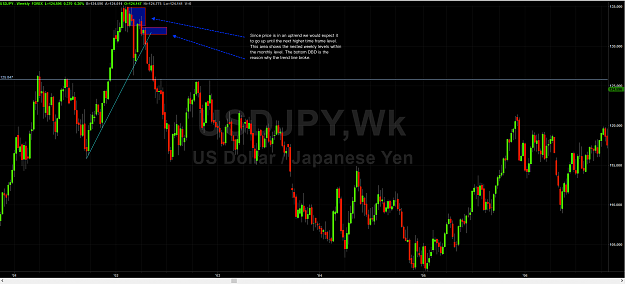
Hey Alfonso. I hope you don't mind but here is what I think currently of the USD/JPY. I hope its not a problem that this is current. I just wanted to analyze something that I could not know the answer too. Most all marks are on the charts below. I have to say that I do have problems with telling CP and peaks apart. This also includes supply/demand in control. How did I do? I do realize that on the charts below there are some zones that I missed. I did not mark ones that would be after a trend line break as they would not be valid. After a trend line breaks price will fall to the nearest zone nested within a higher time frame.
Thanks,
Thanks,
Attached Image(s) (click to enlarge)