Exponential Value Analysis is going to be another core part of the our front end market analysis that will determine if we place a trade or not. It is mapped out by placing TWO Exponential Moving Averages on the chart. What you want to do is on your platform there should be a way to place indicators and go ahead and look for one that says EMA. Place one with a value of 10 EMA and the other at 20 EMA
The Exponential Values can tell us a lot about the current market conditions, whether the market is in an Up Trend, Down Trend , and or getting ready to consolidate.
Notice how the area between the two EMAs mark out an important zone where the market reversed. During trending conditions, in between the EMAs most often it will act as dynamic support or resistance because small counter trend movements will most likely terminate and reverse in continuation with the strong trend. In between the EMA it creates Hot Spots on the chart where heavy buying or selling activity will spike, ESPECIALLY when the market has already established a clear direction.
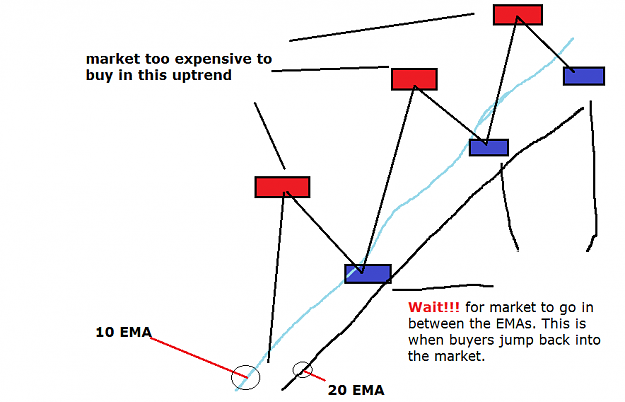
UP TREND
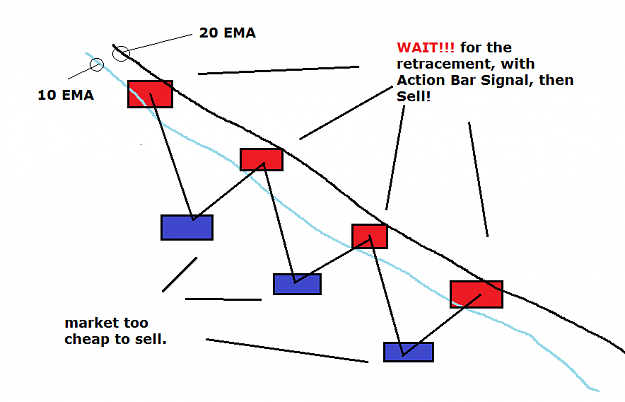
Down Trend Below
Look at the charts Below, Lets identify how the EMAs can help us decide when the market is trending either Up or Down:
Down Trend with EMAs
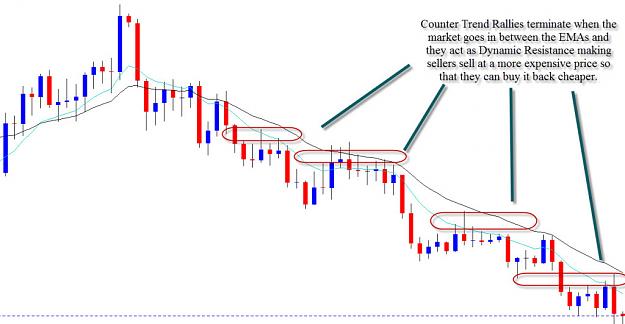
During Trending conditions the relationship between the market price and the EMAs is very clear. In the example above you notice it is a clear downtrend. Also take notice that the market sticks close to the EMAs and will respect it as dynamic resistance.
Up Trend with EMAs
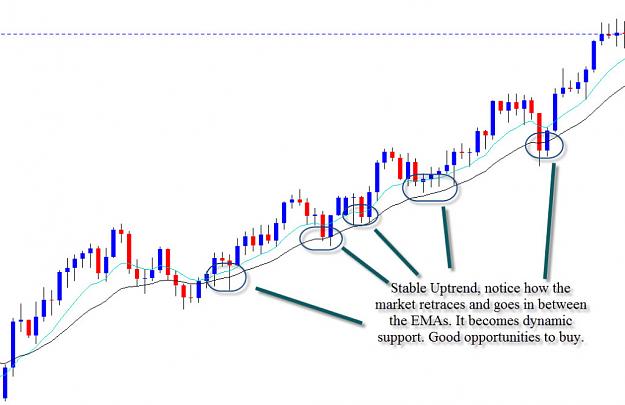
Notice the Chart above how the market likes to stay close to the EMAs. Basic principle the market likes to stay close to the EMAs, retrace and continue in the direction of the trend either up or down.
Identifying Unstable Market Direction
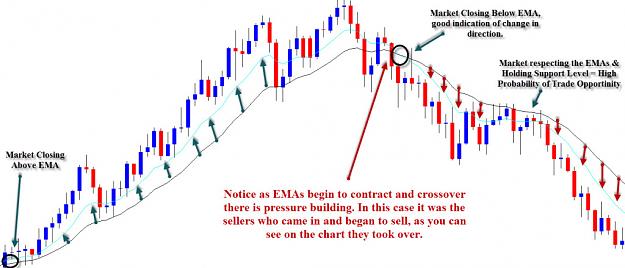
Remember to keep in mind that when the market is respecting the EMAs, it means that the market it is in the a trend stability and so far trading conditions and opportunities are the best!
So if the EMAs start to get take out and not respected it will indicate that the market is unstable and it is some times not worth trading because of the volatility and stops can get taken out and then reversed. (example below)
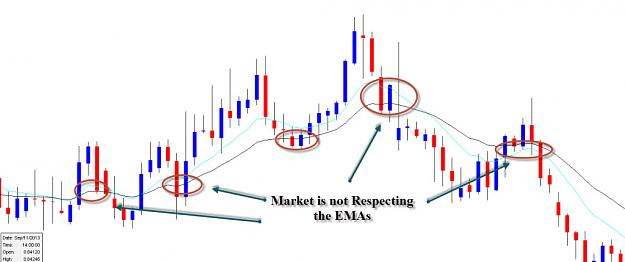
Notice how the market is not respecting the EMAs, this is how you will know to stay away and wait for a better opportunity to get into the market. The best thing to do is look at another chart. You will save yourself time, and better yet CAPITAL!
Consolidating Markets and EMAs
In a Consolidating Market (Range market) the EMAs will be in a sideways motion and it will be in the middle while price is going all over the place! (click picture to make it bigger)

In a Consolidation, you will notice that the market will certainly flatten out completely and will remain in the center of the market. Another key point to notice is how price is moving in unstable swings up and down and does not really have a clear direction of where it wants to go. Once again it is best to stay away from these markets.
EMA Divergence
What is Divergence and what can the EMAs tells us about Divergence ?
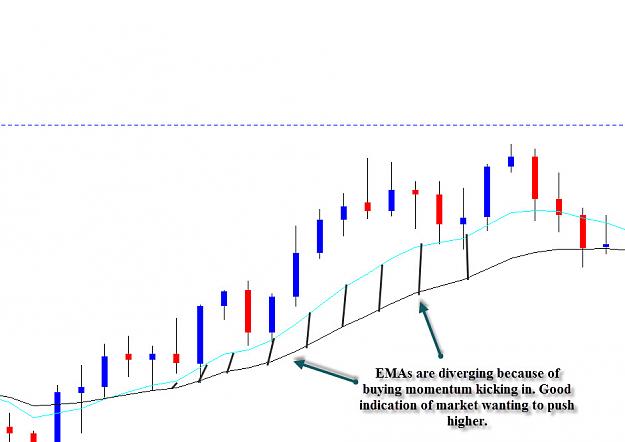
Divergence happens when the EMAs crossover and the 10EMA begins to move away from the 20EMA indicating that the market is gaining strength in momentum.
As Pressure in either upside or downside begins to build the EMAs start to diverge as there is buying momentum or selling momentum.
Also another thing to notice is that the Market (IF) it is respecting the EMA then there is trend stability. Plus it is a good time to look for Action Bar Signals!
As the EMA pull further apart from eachother it indicates that the market is building up strength. If it begins to contract it will indicate that the trend is losing steam and you may want to look for near resistance / support for further continuation or that the trend may just be coming into and END! These are early warning signs to look out for because the market can also go into a choppy mode so just be vigilant and stay calm, keep in mind that it takes a whole day for each candle to develop!
FOREX MODULE 1 – Support & Resistance
http://www.forexfactory.com/showthread.php?t=550724
Forex MODULE 2 – BASIC MARKET Analysis - Up , Down, Sideways
http://www.forexfactory.com/showthread.php?t=550725
Forex MODULE 3 – MARKET Consolidation (MORE IN DEPTH)
http://www.forexfactory.com/showthread.php?t=550726
Forex MODULE 4 – Exponential VALUE Analysis - Daily Time Frame
http://www.forexfactory.com/showthre...28#post8400128
The Exponential Values can tell us a lot about the current market conditions, whether the market is in an Up Trend, Down Trend , and or getting ready to consolidate.
Notice how the area between the two EMAs mark out an important zone where the market reversed. During trending conditions, in between the EMAs most often it will act as dynamic support or resistance because small counter trend movements will most likely terminate and reverse in continuation with the strong trend. In between the EMA it creates Hot Spots on the chart where heavy buying or selling activity will spike, ESPECIALLY when the market has already established a clear direction.
UP TREND
Attached Image (click to enlarge)
Down Trend Below
Attached Image (click to enlarge)
Look at the charts Below, Lets identify how the EMAs can help us decide when the market is trending either Up or Down:
Down Trend with EMAs
Attached Image (click to enlarge)
During Trending conditions the relationship between the market price and the EMAs is very clear. In the example above you notice it is a clear downtrend. Also take notice that the market sticks close to the EMAs and will respect it as dynamic resistance.
QuoteDislikedTIP: When the Market respects the EMAs as dynamic Support or Resistance, it is a really good sign of trend stability and it is also a good opportunity for you to get into the market at take some profits.
Up Trend with EMAs
Attached Image (click to enlarge)
Notice the Chart above how the market likes to stay close to the EMAs. Basic principle the market likes to stay close to the EMAs, retrace and continue in the direction of the trend either up or down.
Identifying Unstable Market Direction
Remember to keep in mind that when the market is respecting the EMAs, it means that the market it is in the a trend stability and so far trading conditions and opportunities are the best!
So if the EMAs start to get take out and not respected it will indicate that the market is unstable and it is some times not worth trading because of the volatility and stops can get taken out and then reversed. (example below)
Attached Image (click to enlarge)
Notice how the market is not respecting the EMAs, this is how you will know to stay away and wait for a better opportunity to get into the market. The best thing to do is look at another chart. You will save yourself time, and better yet CAPITAL!
Consolidating Markets and EMAs
In a Consolidating Market (Range market) the EMAs will be in a sideways motion and it will be in the middle while price is going all over the place! (click picture to make it bigger)
Attached Image (click to enlarge)
In a Consolidation, you will notice that the market will certainly flatten out completely and will remain in the center of the market. Another key point to notice is how price is moving in unstable swings up and down and does not really have a clear direction of where it wants to go. Once again it is best to stay away from these markets.
EMA Divergence
What is Divergence and what can the EMAs tells us about Divergence ?
Divergence happens when the EMAs crossover and the 10EMA begins to move away from the 20EMA indicating that the market is gaining strength in momentum.
As Pressure in either upside or downside begins to build the EMAs start to diverge as there is buying momentum or selling momentum.
Attached Image (click to enlarge)
Also another thing to notice is that the Market (IF) it is respecting the EMA then there is trend stability. Plus it is a good time to look for Action Bar Signals!
Attached Image (click to enlarge)
As the EMA pull further apart from eachother it indicates that the market is building up strength. If it begins to contract it will indicate that the trend is losing steam and you may want to look for near resistance / support for further continuation or that the trend may just be coming into and END! These are early warning signs to look out for because the market can also go into a choppy mode so just be vigilant and stay calm, keep in mind that it takes a whole day for each candle to develop!
FOREX MODULE 1 – Support & Resistance
http://www.forexfactory.com/showthread.php?t=550724
Forex MODULE 2 – BASIC MARKET Analysis - Up , Down, Sideways
http://www.forexfactory.com/showthread.php?t=550725
Forex MODULE 3 – MARKET Consolidation (MORE IN DEPTH)
http://www.forexfactory.com/showthread.php?t=550726
Forex MODULE 4 – Exponential VALUE Analysis - Daily Time Frame
http://www.forexfactory.com/showthre...28#post8400128