1. IT GOES UP
2. IT GOES DOWN
3. & IT GOES SIDEWAYS
Thats it! Easy right? But hold on there buddy, before you go in there into your account and start buying and selling like a mad person You need to learn how to read the market like a book! is that really all you need in order to make money in the market? No, but before I let you go and have you start a real account and risking money, you need to learn the basic fundamentals of how the market loves to move and it is going to be useful for identifying and gauging at what are the current market conditions: is it going Up, Down, or Sideways!
QuoteDislikedQUICK ANALOGY: Just like surfer waiting for that one perfect wave to ride. You wont see a surfer riding the waves in a very dangerous hurricane churned waters; there will be plenty of waves to take, but they wont be synchronized and will be extremely volatile and unpredictable. No matter how good of a surfer you are, there is a higher chance that youll be caught in strong currents that will take you out to sea and then drown you.
On the flip side, a surfer isnt going to jump into the water where it is flat and producing no waves at all right? Sometimes if not most, it is best to wait and come back another day! The water is not going anywhere and neither is the market.
Attached Image (click to enlarge)
In this Module you are going to learn How to Identify 3 things: 1. Up Trends , 2. Down Trends and when Market is in a 3. Range (or also known as Consolidation/ Choppy)
1. Up Trend

NSH = New Structure High
HL = Higher Low
The picture that you see above is an uptrend: notice how it moves in a sort of wave motion but at the same time it is heading North! The reason why I put NSH is because when the market creates a new impulse leg(see chart below) and pushes through a certain key level of previous NSH THEN THE NEW NSH becomes the highest high of that trend and therefore becomes a New Structure High. Sooner or later the market will retrace creating a HL(higher low) and when it does, it will create another Impulse leg up breaking through previous NSH and creating a NEW NSH and so on and so forth until there is no more strength in the market and the buyers can no longer continue pushing the market up & that is exactly how the market loves to move in an Up Trend. Now Lets look at a real market scenario below:
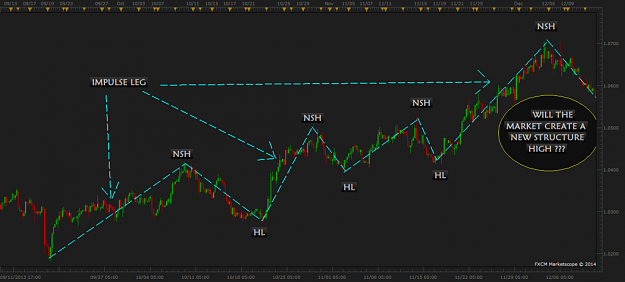
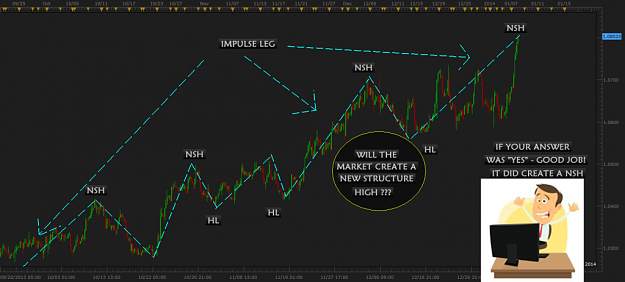
Notice how when the market creates an Impulse leg UP it creates a New Structure High (NSH) its not as perfect as the drawing that I made but it serves its point that the market loves to move in a zig zag upwards movement in an UP TREND. It also retraces creating Higher Lows ( HL ) and then once again you get an impulse leg move and creates a (NSH): Now judging from the chart the questions is Will the market create a new structure high?
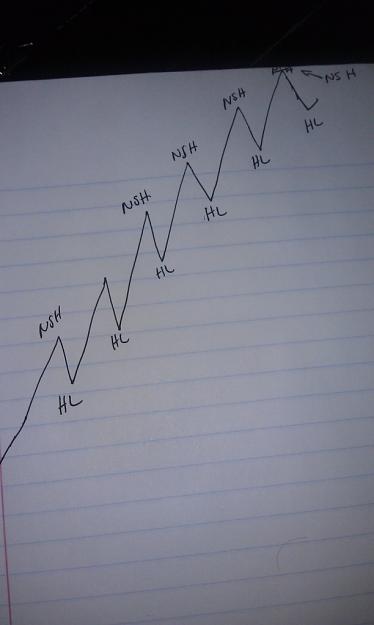
Awesome good work You now know what is an Up Trend and how the market moves in an Up Trend. Time for some Homeworkdont worry this is going to be fun! What I want you to start doing before you begin to look at a chart I want you to grab a piece of paper and pen and I want you to being to draw a zig zag Upwards motion like drawing and add the labels NSH and HL, draw it as many times as you can, this will serve its purpose in training your mind to begin to identify the uptrend motion, so that when you approach the market your mind will being to see that type of pattern. Im serious for example like this below:
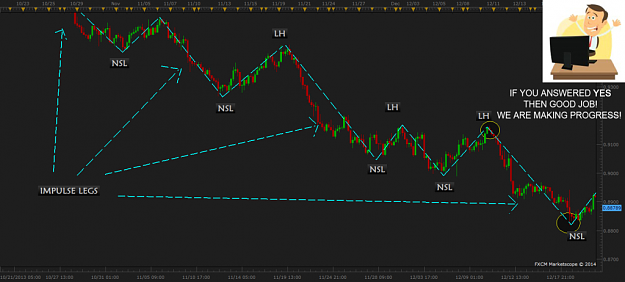
2. Down Trend

NSL = New Structure Low
LH = Lower High
Now this is a Down Trend. It looks exactly like the up trend only that this one is inverted and it is heading SOUTH! In this Down Trend the same concept applies, when you get an Impulse Leg downwards and a previous NSL gets broken, then be ready for a small retracement up creating a LH and then creating another Impulse leg creating a NSL (New Structure Low).
Lets look a chart example!
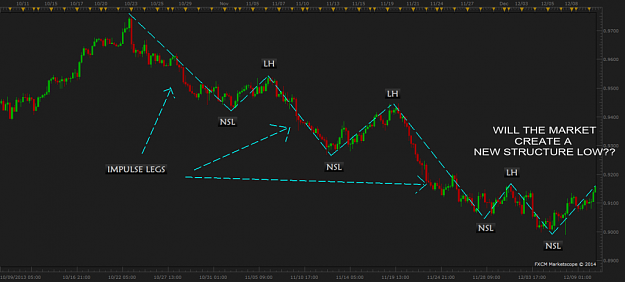
Here we go again in a real trading environment where the market was creating New Structure Lows and Lower Highs. Notice how the Impulse legs are always larger than the retracements and they also always break through a previous NSL in order for it to be considered a NEW NSL. Once more go ahead and answer the question: Will the market create a New Structure Low?
So yes once again you were correct! Now, will the market always follow this type of pattern of zig zag downwards? for the most part it does when it is heading South and you will see it over and over and over and over again. Will you be able to make money off these type of moves, you can! BUT most importantly, you will need to know this skill so that you have an idea of where the market is most likely going to move next! Remember everyone is watching the same thing. No one in the market is special and if you do not know how to approach the market correctly then you deserve to lose your money!
Once again for your home work go ahead and do the same thing I asked you to do for the Up Trend Zig Zag Movement which was to draw it on a piece of paper as many times as it may fit and label them Do the same thing for the Down Trend as well! THIS IS IMPORTANT!
3. Range ( Consolidation )

This is what a market Range does: It pretty much just bounces up and down in a side ways motion and its pretty much choppy and can sometimes even get very volatile! Now, in the FOREX Market Volatility is always good, but when it comes to ranges it is always best to wait for a break through and then follow up with either a downtrend or uptrend we never know, so the best thing to do is to sit back and wait, why risk our money when there is no need to, but if there is an opportunity then Yes it would be wise to take it, although you will learn that more into the next chapters.
Lets look at a market example:
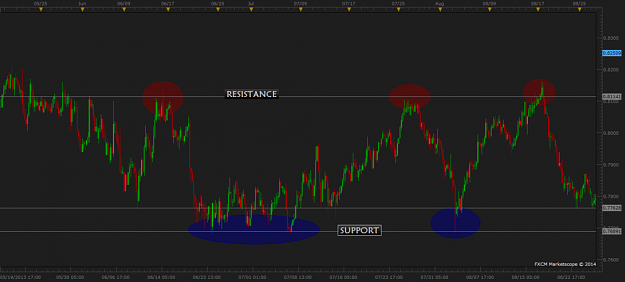
AWESOME CHART HUH! Now really at this point the market is in a huge Range and Prices are moving up and down the points of Resistance and Support. Remember what we talked about Resistance and Support : Depending on the Time Frame and more times that level has HELD the more IMPORTANT it becomes. Can we take advantage of these Range moves HELL YES!! but there is way and it must be approached with caution, once again we are here to invest and make money, not to lose it. So just really quick as you see the market coming down to the BLUE SUPPORT Area do you think the market will hold and continue moving up??? or will it breakthrough?
FOREX MODULE 1 – Support & Resistance
http://www.forexfactory.com/showthread.php?t=550724
Forex MODULE 2 – BASIC MARKET Analysis - Up , Down, Sideways
http://www.forexfactory.com/showthread.php?t=550725
Forex MODULE 3 – MARKET Consolidation (MORE IN DEPTH)
http://www.forexfactory.com/showthread.php?t=550726
Forex MODULE 4 – Exponential VALUE Analysis - Daily Time Frame
http://www.forexfactory.com/showthre...28#post8400128