• Home
  • Forums
  • Trades
  • News
  • Calendar
  • Market
  • Brokers
  • Login
  • Join
  • User/Email: Password:
  • 8:00pm
Menu
  • Forums
  • Trades
  • News
  • Calendar
  • Market
  • Brokers
  • Login
  • Join
  • 8:00pm
Sister Sites
  • Metals Mine
  • Energy EXCH
  • Crypto Craft

Options

Bookmark Thread

First Page First Unread Last Page Last Post

Print Thread

Similar Threads

Broker Challenge "NDD/STP" vs. True "ECN" and "Mkt Mkr" broker talk 46 replies

Dealing with "Invalid Price", "Requote", "Server Busy" in MT4 3 replies

Recommended "no last look", fast execution, reliable brokers 11 replies

Looking For "COUNTER TREND" To Become "TREND" 29 replies

"Bagovino Method" VS "Cornflower Hourly System" 16 replies

  • Trading Discussion
  • /
  • Reply to Thread
  • Subscribe
  • 16
Attachments: Reliable method to know when a "trend" has started?
Exit Attachments

Reliable method to know when a "trend" has started?

  • Last Post
  •  
  • 1 Page 23 4
  • 1 Page 23 4
  •  
  • Post #21
  • Quote
  • Edited at 4:19am Jul 2, 2015 3:55am | Edited at 4:19am
  •  aediaz1
  • Joined Aug 2007 | Status: Member | 3,134 Posts
I use a combination of two variables to define a trend;

1. If price have moved above daily average range (based on the 30 past days)
2. Daily closing price near high/low


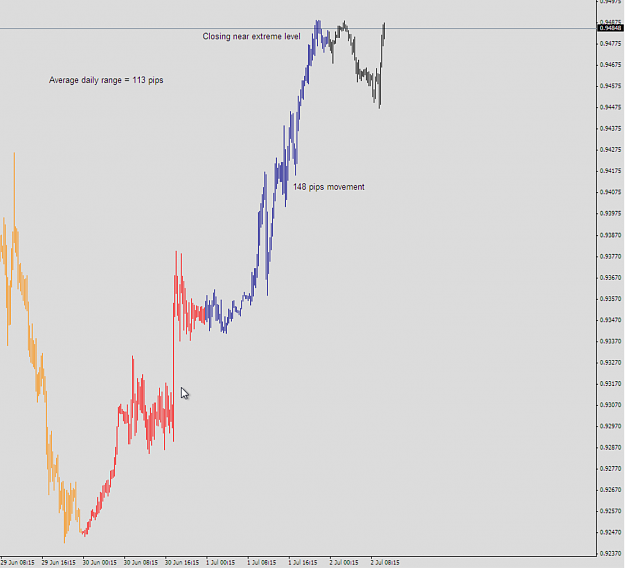
Take usd/chf for example. The 30 days average range is 113 pips. Yesterday it moved almost 150 pips (which is of course above daily average) and closed near the session high. What usually (remember, there are on guarantees in trading) follows, is a move in the same direction. As with any information on this forum, dont swallow it raw - find out for yourself if this is true.
Attached Image (click to enlarge)
Click to Enlarge

Name: Skjermbilde 2015-07-02 kl. 09.48.33.png
Size: 167 KB
Measure twice, cut once
 
 
  • Post #22
  • Quote
  • Jul 2, 2015 4:07am Jul 2, 2015 4:07am
  •  Spoon138
  • | Joined Aug 2014 | Status: Member | 141 Posts
personally I find moving averages very useful for trends for the very reason that they lag depending on their value. I (please don't laugh) still use an MA cross to identify trend changes simply because they only cross at a point where a trend has established obviously depending on value and TF. but they remain only an indication not a signal as such.
 
 
  • Post #23
  • Quote
  • Jul 2, 2015 4:31am Jul 2, 2015 4:31am
  •  tamiflu
  • | Joined Jul 2011 | Status: Member | 60 Posts
Discussion about the trend is an endless question.You have to consider that every scenario can be interpreted as an uptrend or a pullback of a downtrend.
In every case there has to be traders who consider it in one way and other traders considering it in other way.
If everybody agrees on the direction of the trend there will be on the market only buyers or sellers which is impossible.
You have to consider both situations and to decide which is more probable. Using good RR you can win money even with a WR of 35-40%.
My 2 cents.
 
 
  • Post #24
  • Quote
  • Jul 2, 2015 4:39am Jul 2, 2015 4:39am
  •  Mingary
  • Joined Mar 2011 | Status: I should be on your ignore list | 5,544 Posts
You can observe there is a trend.
Anyone can see that the price when from price a to price b (i.e. higher highs, higher lows)
The same trend "disappears" once you have committed funds to it.
 
 
  • Post #25
  • Quote
  • Jul 2, 2015 5:17am Jul 2, 2015 5:17am
  •  Shabs19
  • Joined Aug 2006 | Status: Member | 2,955 Posts
Mingary - as usual funny remarks.

Trend is all subjective to timeframe that you are looking at. The higher timeframe will always be superior.
Trend is always about getting in early as you can.
Follow the Money
 
 
  • Post #26
  • Quote
  • Jul 2, 2015 5:18am Jul 2, 2015 5:18am
  •  staw
  • | Joined Nov 2009 | Status: Member | 29 Posts
Quoting Orolo
Disliked
{quote} not quite true, you can have a up trend, down trend and sideways trend. 3 trends can exist in any time frame.
Ignored
There is no such a thing as "sideways trend" in reality. Theoretics who like to give things their names who invented this term. Think of accumulation and distribution instead of up/down/sideways trend. I put it another way - price is always going in waves because those who want to buy/sell in huge volumes (the volumes that exceed current orderbook) need to create opposite pressure - if they want to buy they need to find those who wants to sell and vice versa. If their order is bigger than market can absorb at current price then they break this huge order into few smaller orders. Those small pullbacks that you see on your charts are exactly that kind of pressure that is created to offload big orders. The only times when the price is not going in waves are extreme times when huge orders are offloaded "as is" without breking down in smaller orders if needed (in case of news events for example). So, what you refer to as "sideways trend" might be either prolonged pullback or a change of direction of the trend. If you still feel that there are such things as sideways trend I urge you toll post a screenshot and show me a concrete example.

Quoting Orolo
Disliked
{quote}the bigger the time frame the less likely a sideways trend exists
Ignored
The odds of "something is more/less likely to happen" does not depend on the timeframe. You will not know for sure what timeframe it is if I show you a extract of a chart without telling you what timeframe it is. The only things that differs higher TFs from lower TFs are frequency of the signals, lotsize due to different sizes of stops/targets and hence spread/commision size related to your stops/targets.
 
 
  • Post #27
  • Quote
  • Jul 2, 2015 6:46am Jul 2, 2015 6:46am
  •  m3rlin
  • Joined Jul 2013 | Status: Member | 228 Posts
Quoting Singha83
Disliked
Basically, I am not looking for a profitable trading system. I have one but with a big "asterisk" next to it. The big asterisk is I need to find a way to cut losses. I do not want to use a set "pip" price nor use price action because of stop hunts/false breaks. What I have noticed is though... the lagging nature of indicators are great for detecting stop hunts (indicators can often ignore them) or for a confirmation of a trend (late but often a highly probable confirmation) simply because of their lagging nature. Basically, I am looking to use my...
Ignored
your exit can't be arbitrary,you need to think the exit in context of entry.(it necesarly to be profitable ).For example if you use a SMA200&SMA50 crossover for entry you can exit at a new crossover,or you can exit faster from a profitable position at a break of sma50,or sma20 etc.You need to test to find best performance (be aware of data optimization)
Price itself it's an indicator
 
 
  • Post #28
  • Quote
  • Jul 2, 2015 7:28am Jul 2, 2015 7:28am
  •  Quants
  • Joined May 2015 | Status: ... | 446 Posts
There is a few simple way to determine turnaway points.

Rules of trend change for technical analysis

1- There sould be strong / Buy or Sell zone. (Weekly , Daily , Monthly high and lows , SR , Pivots )
2- Price should be Loosing Momentum and strength deacreasing angle. (New higher highs and lower lows are not created)
3- U and M formations are triggered.
4- Usually Weekly or Daily range is Done , There is no more room to go.

Did you ever drive a car ?

If you are looking to go from point A to C

A----------->B---------C

A= The point is where you have decided your direction (Fresh orders came in to market)
B= Your speed of speed is @MAX and your speed is increasing in a nice momentum. If you want to stop your car and turn back to ''Point A''
first of all you should decrease your speed. Otherwise you will not able to turn back.
C= The moment where your car about to stop or Slowing down to going back...

Accept this theory in to the market and trending pairs.

Instead of A B C , There is a Order ZONES.

Price moving between of them..

So , If there is no more enough room to go,

Before turning it should slowing down.

If you can see that , You can predict trend change..

I suggest looking in to All time frames as one avarage.

A simple screenshot of reversal.
Attached Image (click to enlarge)
Click to Enlarge

Name: Screenshot3.png
Size: 27 KB
I will not beg anyone to make money for them
 
 
  • Post #29
  • Quote
  • Jul 2, 2015 8:00am Jul 2, 2015 8:00am
  •  highway
  • Joined Sep 2005 | Status: Member | 1,352 Posts
What happened when FED said they are going to start QE?
What happened when BOJ said they are going to start QE?
What happened when ECB said they are going to start QE?

What happens now when FED said they are going to raise rates?
 
 
  • Post #30
  • Quote
  • Jul 2, 2015 8:10am Jul 2, 2015 8:10am
  •  puney
  • | Joined Aug 2010 | Status: Member | 194 Posts
Reliable method to know when a "trend" has started?

I use to ask the same question to myself all those years ago. You can never predict when the "trend" has started. A "trend" for one person is the end of the "trend" for another.

However what is more important question is what you can do with key support/resistance levels(not the trend)
 
 
  • Post #31
  • Quote
  • Jul 3, 2015 10:53am Jul 3, 2015 10:53am
  •  NorthTrader
  • Joined May 2013 | Status: Digging deeper | 653 Posts
Here is one way of thinking about trends:

Before Trend
Price is choppy and ranging. Smart money is picking a direction and secretly loading up. They're also trying to outsmart everyone else by sending price in the wrong direction (false moves and false break outs).
Can we spot this and decipher their trickery? I think it's difficult. After all, that's why they're smart! But not impossible.

Start of trend
Smart money gets the ball rolling with some large initial positions. Can we spot this? Yes we can. Especially if we combine volume and price analysis. The hard part is differentiating between false moves and the real one. Some people here on FF say that they can do this. Personally I'm still working on it.

First part of trend
Lots of money pouring in from both smart money and everyone else. Srong moves in the direction of the trend, followed by weak retraces caused by not-so-smart money cashing in their profits too early. Smart money adds on the retraces to keep the trend going.

Middle part of trend
Less inflow from smart money, more from not-so-smart.

Last part of trend
NO inflow from smart money, only outflow. Their sell orders (in an uptrend) are being bought by the not-so-smarts, who still think the trend is going strong.

Trend over
The smart money's already out, and price becomes erratic due to lower volume and confusion. Then fear sets in and the not-so-smarts all try to rush for the exit door at the same time. Price falls fast (after an uptrend) because there's no one left to sell to!

Of course this view is rather simplistic and in reality I doubt that things always go as smoothly as this for the smart money. What about changes of sentiment caused by news and data releases? How do they handle that?
And there are trends within trends within trends. A ranging market on a lower timeframe might be a period of consolidation on a higher timeframe before the longer-term trend continues.

So, back to the original question. How can we spot the start of a trend? I think there are two ways to get in early:

1) Get in before or just after smart money has started the trend.
After hours of looking at price action, volume and the order book (if available) on very low timeframes in ranging markets, I am finally starting to see subtle hints that point to the direction that smart money is taking. But these clues are so subtle that at the moment I don't trust them enough to act on. And there's still the thorny problem of false moves to weed out. But I dare say that someone with a better eye than me will be able to spot them easier.

2) Get in on the first weak retrace.
If you can't spot the direction before it starts, then the next best place to enter is during the first retrace which takes place after the initial strong move. But this is also tricky. How much retrace do you allow? Do you base it on indicators such as fibs and MAs, or just gut feeling? And how do you know it's weak enough - is it part of a new trend or is it a reversal back to the previous range? Volume and price analysis help with this.

As always, there's no free lunch, and losing sensibly is part of the game. But hopefully getting in near the start of a big trend, and having the discipline to ride it to the end - adding along the way if possible - will compensate for the inevitable mistakes and frustrating small losses
You reap what you sow.
 
 
  • Post #32
  • Quote
  • Jul 3, 2015 5:20pm Jul 3, 2015 5:20pm
  •  Giganntor
  • | Joined Feb 2015 | Status: Member | 128 Posts
Quoting NorthTrader
Disliked
Here is one way of thinking about trends: Before Trend Price is choppy and ranging. Smart money is picking a direction and secretly loading up. They're also trying to outsmart everyone else by sending price in the wrong direction (false moves and false break outs). Can we spot this and decipher their trickery? I think it's difficult. After all, that's why they're smart! But not impossible. Start of trend Smart money gets the ball rolling with some large initial positions.
Ignored
A great post North. Your thread is concise, to the point and very accurate.
 
 
  • Post #33
  • Quote
  • Jul 3, 2015 5:49pm Jul 3, 2015 5:49pm
  •  awan0454
  • | Joined Dec 2009 | Status: Member | 17 Posts
We always learn this formula of trading successfully and that is to keep things as simple as possible and simplest formula to find if market is trending or not is just draw trend lines. If you are able to connect a high with a higher low then market is trending upward and your odds of trading a bounce from this upward trend line are very high. Same is true for down trends .
 
 
  • Post #34
  • Quote
  • Jul 4, 2015 4:20am Jul 4, 2015 4:20am
  •  Mingary
  • Joined Mar 2011 | Status: I should be on your ignore list | 5,544 Posts
Quoting NorthTrader
Disliked
Here is one way of thinking about trends: Before Trend Price is choppy and ranging. Smart money is picking a direction and secretly loading up. They're also trying to outsmart everyone else by sending price in the wrong direction (false moves and false break outs). Can we spot this and decipher their trickery? I think it's difficult. After all, that's why they're smart! But not impossible. Start of trend Smart money gets the ball rolling with some large initial positions. Can we spot this? Yes we can. Especially if we combine volume and price analysis....
Ignored

IMO Smart Money is not smart but they act very much like elephants in a china shop (:
 
 
  • Post #35
  • Quote
  • Jul 4, 2015 4:51am Jul 4, 2015 4:51am
  •  NorthTrader
  • Joined May 2013 | Status: Digging deeper | 653 Posts
Quoting Mingary
Disliked
{quote} IMO Smart Money is not smart but they act very much like elephants in a china shop (:
Ignored
That sounds more like CBs to me
You reap what you sow.
 
 
  • Post #36
  • Quote
  • Jul 4, 2015 7:06am Jul 4, 2015 7:06am
  •  Giganntor
  • | Joined Feb 2015 | Status: Member | 128 Posts
Quoting Mingary
Disliked
{quote} IMO Smart Money is not smart but they act very much like elephants in a china shop (:
Ignored
I agree. You can track smart money. It takes a high level understanding of market structure and how smart money makes money. Most charts look confusing but if you know how to track the big boys you can find their targets with suprising accuracy. Finding their targets isn't that hard-time (holding your trade for days on end as they stop everyone out both ways while they accumulate huge positions, that is where you need the patience of a saint and that is where the money is.
 
 
  • Post #37
  • Quote
  • Jul 4, 2015 7:33am Jul 4, 2015 7:33am
  •  jim032
  • | Joined Jul 2015 | Status: Junior Member | 2 Posts
If you mean a new trend out of accumulstion zone, have to wstch accumulatin zone all way down
When all floating lots have been taken by SM you will see a total lack of any sell offs as green candles develop.
You will see that market resistance is removed and minimal sellers around toprovide resistance to beginning of up move.
Only when all resistance is gone will the SM begin to markup. When you have
Watched this develop if there is any resistance before a big move the SM wil fake up and then move down anothrr level to
Clear out any deeper sellers. When it is clear no resistsnce remains will markup.
Watch the markup initisl phase carefully if clear lack of sellers will solidly move up with no resistance in phases.
See recent usdjpy which shows this clearly. Move from deep resistance base down until no sellers left then strong mark u.
 
 
  • Post #38
  • Quote
  • Jul 4, 2015 7:49am Jul 4, 2015 7:49am
  •  jim032
  • | Joined Jul 2015 | Status: Junior Member | 2 Posts
As far as i can make out there are two major players directing up and downmoves

SM who buy in volume will sell at significantly higher prices. Then the liquidity providers who HFT

To offset sold stock. The HFT are mini accumulation disttibution phases th low volume. The SM

Acvumulation distribution and HFT are clearly visible in tick volume charts. Watch tge herd alone try to move the market

They can move nothing feeble moves up and down the only significant moves are by major players

With large tick volumes. They buy on a red candle down the tail is where the

Majority of buying occurs you will see tick volume go crazy on the tail as it retraces.

Seling is on top of green agian crazy volume equals sell off.
 
 
  • Post #39
  • Quote
  • Jul 4, 2015 9:07am Jul 4, 2015 9:07am
  •  Inceptionist
  • Joined Jun 2014 | Status: Member | 195 Posts
Read the attached PDF...It was very helpful to me..I believe you can find something useful here in this e-book. Regards.
Attached File
File Type: pdf ForexTrendy.pdf   904 KB | 845 downloads
Simplicity is the key to brilliance.
 
 
  • Post #40
  • Quote
  • Jul 15, 2015 9:40am Jul 15, 2015 9:40am
  •  rohitbose
  • | Additional Username | Joined Jun 2015 | 18 Posts
There are various patterns/ trends which one can follow to identify the trend. Some of them are explained here.

"Doji stars" - Prices at the open and close of the period are at the same level, indicating indecisiveness between bulls and bears. A Doji is quite often found at the bottom and top of trends and thus is considered as a sign of possible reversal of price direction.

"Stars" - Stars are reversal patterns and come in several different forms. The pattern consists of three candles, the first usually a large candle at the end of an extended trend followed by a smaller candle that leaves a gap or window and then another large body candle in the direction of the new trend. Large volume would help to confirm the reversal signal.

"Hammer" and "Hanging Man" - These two reversal patterns look very much alike, but their name and impact on prices depend on whether they occur at the end of a downtrend or an uptrend. The signal candlestick has a small real body and a long lower shadow, suggesting the previous trend is losing momentum. This pattern also requires confirmation by the next candle.

"Harami" - The harami is a reversal pattern following a trend. Rather than engulfing the previous candle, price action for the current candle is entirely within the range of the previous candle body. This pattern requires immediate follow-through for confirmation.

"Engulfing patterns" - Prices open below the previous close (bullish) or above the previous close (bearish) and then stage a strong turnaround, producing a candle body that totally engulfs the previous candle and suggesting a change in trend direction.

" Head n shoulders patterns" - Formation of the pattern:-

  1. Left shoulder: Price rise followed by a left price peak, followed by a decline.
  2. Head: Price rise again forming a higher peak.
  3. Right shoulder: A decline occurs once again, followed by a rise forming the right peak which is lower than the head.


  • Trading Discussion
  • /
  • Reliable method to know when a "trend" has started?
  • Reply to Thread
    • 1 Page 23 4
    • 1 Page 23 4
0 traders viewing now
  • More
Top of Page
  • Facebook
  • Twitter
About FF
  • Mission
  • Products
  • User Guide
  • Media Kit
  • Blog
  • Contact
FF Products
  • Forums
  • Trades
  • Calendar
  • News
  • Market
  • Brokers
  • Trade Explorer
FF Website
  • Homepage
  • Search
  • Members
  • Report a Bug
Follow FF
  • Facebook
  • Twitter

FF Sister Sites:

  • Metals Mine
  • Energy EXCH
  • Crypto Craft

Forex Factory® is a brand of Fair Economy, Inc.

Terms of Service / ©2022