Hi guys.
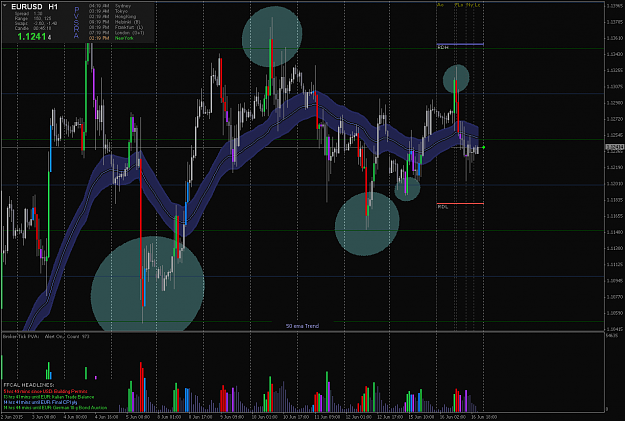
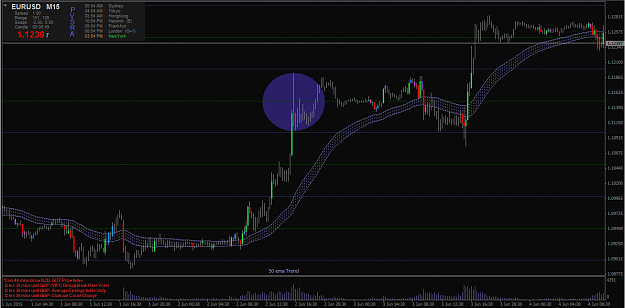
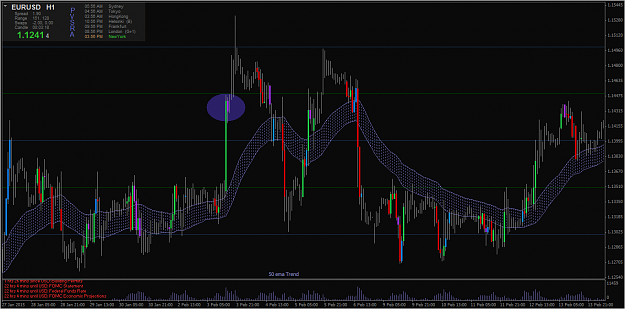
I want to share with you a little PVA trick I noticed. Check out Eurusd H1 chart I posted. Look at the circled areas. Those areas are PVA events, precisely, those are 2 bar PVA events. Whenever you see a price making new high or new low on a PVA event followed immediately by a second PVA event, price reversal is imminent. So if you see a price making new high on a green or a blue candle and is immediately followed by a red or purple candle, price is going to reverse down. If you see a price making new low on a red or purple candle and is immediately followed by a green or blue candle, price is going to reverse up. It is uncanny sometimes how this works. So, when you see such event take place, drill down to a lower time frame for your entry. Interestingly, such events tend to take place above/below 1/1 and 1/2 levels. That is not a coincidence. Of course, traders own discretion is still required, you have to be able to determine new high or low. The last circle on my Eurusd chart shows a PVA event which saved me today from a losing position. Prior to that PVA event, I was long! Needless to say, once it appeared, I bailed out. Check it out guys and may it bring you many, many pips.
 Marijan
I want to share with you a little PVA trick I noticed. Check out Eurusd H1 chart I posted. Look at the circled areas. Those areas are PVA events, precisely, those are 2 bar PVA events. Whenever you see a price making new high or new low on a PVA event followed immediately by a second PVA event, price reversal is imminent. So if you see a price making new high on a green or a blue candle and is immediately followed by a red or purple candle, price is going to reverse down. If you see a price making new low on a red or purple candle and is immediately followed by a green or blue candle, price is going to reverse up. It is uncanny sometimes how this works. So, when you see such event take place, drill down to a lower time frame for your entry. Interestingly, such events tend to take place above/below 1/1 and 1/2 levels. That is not a coincidence. Of course, traders own discretion is still required, you have to be able to determine new high or low. The last circle on my Eurusd chart shows a PVA event which saved me today from a losing position. Prior to that PVA event, I was long! Needless to say, once it appeared, I bailed out. Check it out guys and may it bring you many, many pips.
Attached Image (click to enlarge)