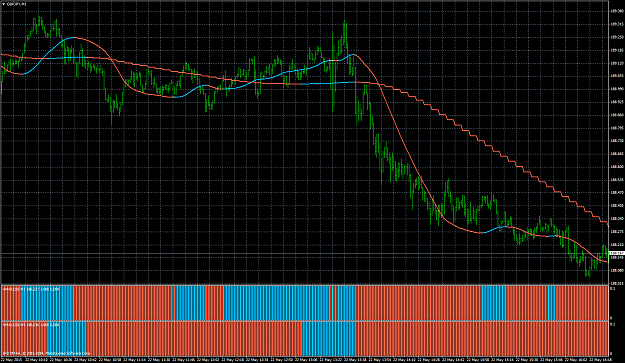
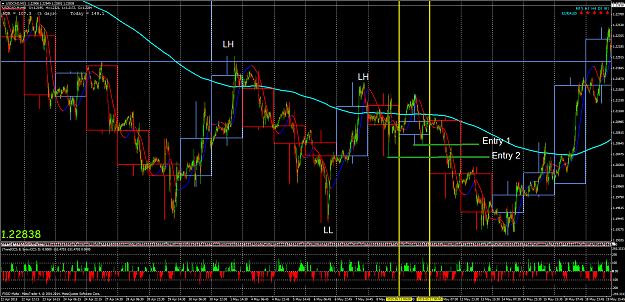
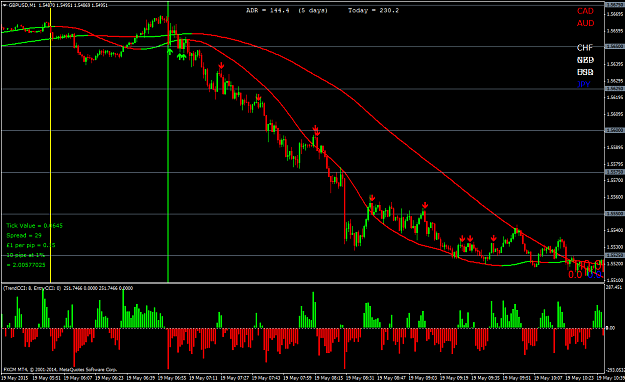
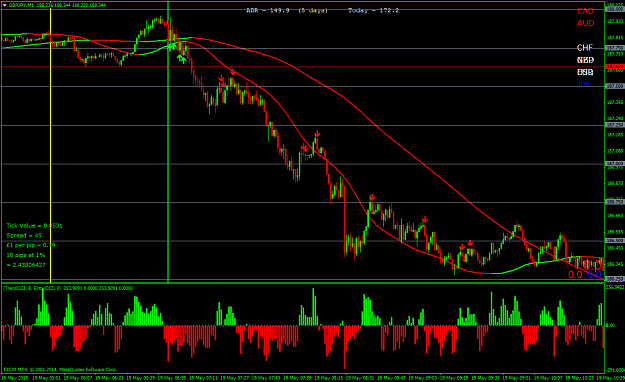
DislikedFor those of you that seek to simplify your trading here's an idea that may help you. Again from last week I showed a 15M chart with daily candles potted on it. Here is how you can basically trade a daily chart using the 15 M chart or if you want to fine tune your entries uisng a 1M chart. Ok, the 15M chart has a 10EMA from the daily chart, aqua line. Trade long above the 10EMA and short below the EMA. This will generally keep you trading with the longer term trend. On this chart we see a higher high and lower high formed and we have a pullback...Ignored
Dave,
can u tell us a bit about the indi in top right hand corner of your chart? Is it based on HA, or open price ? How significant is it in your trades? Can u post it?