Hi Alfonso,
Could you please help me understand something here. On the USD/SGD monthly chart:
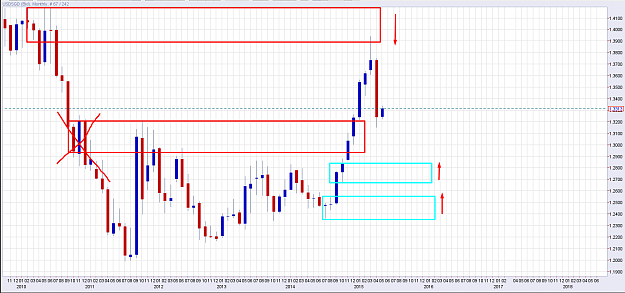
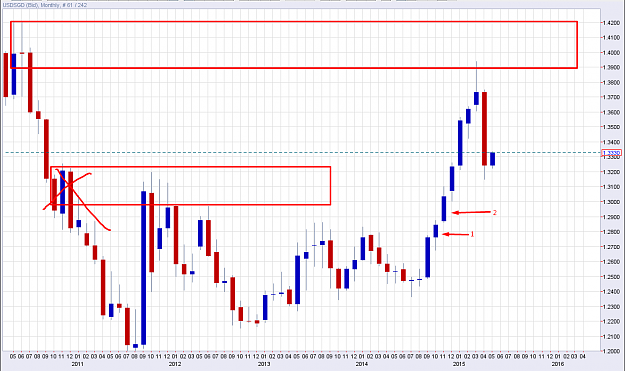
Candle 2 is the one that causes the removal of the monthly supply level on the left.
Candle 1 however is a 50%-candle and is below Candle 2.
Which in this case is the correct Demand zone - the 50% candle (1) or candle 2, that actually removes the opposing supply.
I'm wondering since this situation is new to me, and I think I've seen you classifying only candle 1 as demand in such cases before...
Thanks,
Boris
Could you please help me understand something here. On the USD/SGD monthly chart:
Candle 2 is the one that causes the removal of the monthly supply level on the left.
Candle 1 however is a 50%-candle and is below Candle 2.
Which in this case is the correct Demand zone - the 50% candle (1) or candle 2, that actually removes the opposing supply.
I'm wondering since this situation is new to me, and I think I've seen you classifying only candle 1 as demand in such cases before...
Attached Image (click to enlarge)
Thanks,
Boris