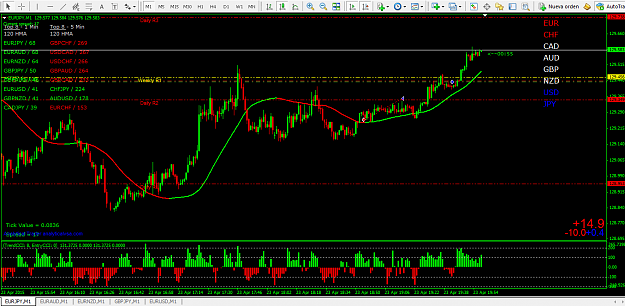
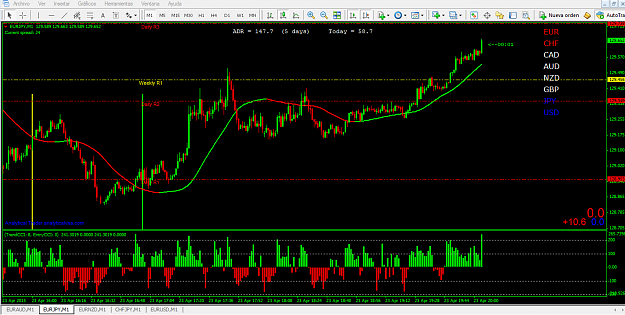
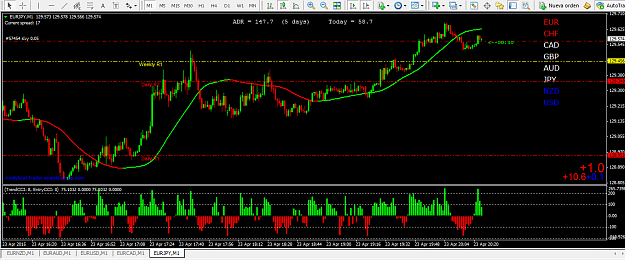
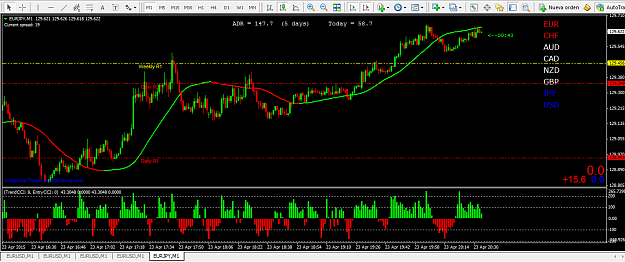
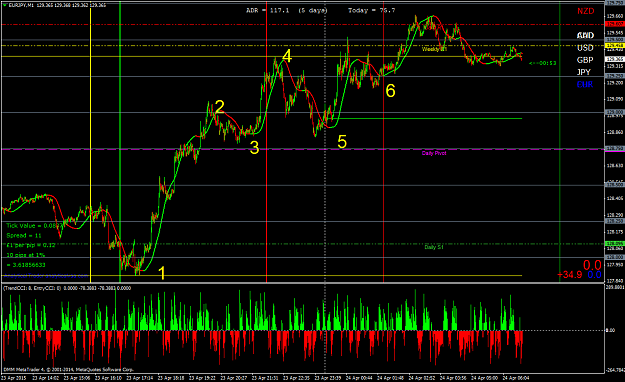
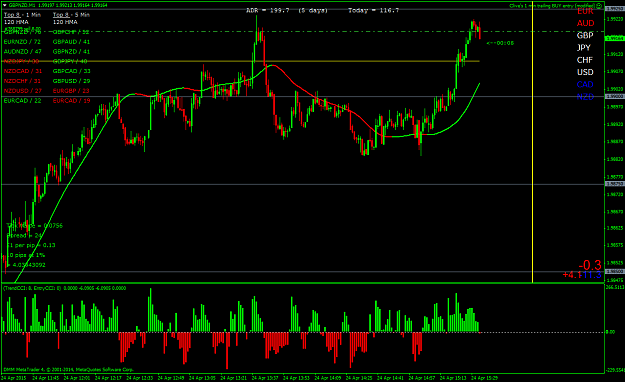
The lines are the markets open and close, the green one is LO, but I don´t use it, come with Clive´s template. 2nd question, in that chart I have HMA 120, and again, come with the Clive´s template.
Disliked{quote} Trinquete : I can see that your yellow vertical line represents the NYopen, but , what about the green vertical line ?? 2nd question : Is it your lwsma at 100 ?? I mean, in my chart, the price is a little far from the lwsma ...., can you answer me, please ??Ignored