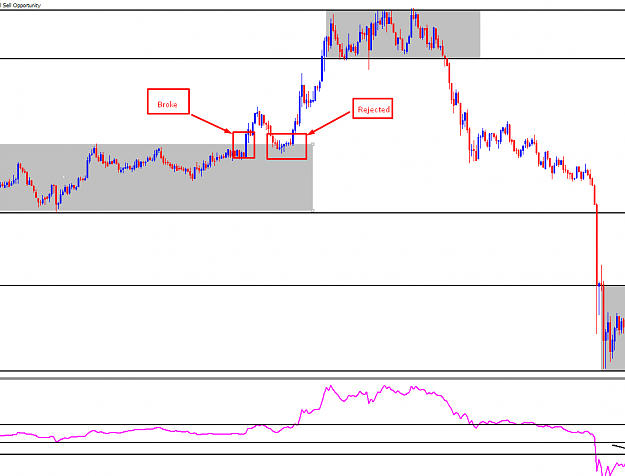
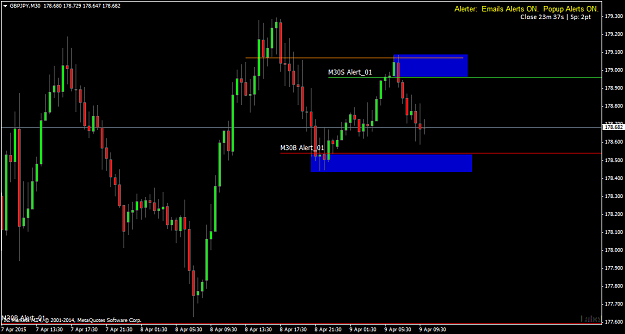
{quote} Hi all, would like to give my view: price dropped because of the significant supply marked, it is where supply consumed demand that lead to HH this new supply is formed after hitting an H4 SR at 179.140 and getting strong rejection {image}
Ignored
I agree. And there was a profit there to be had, and many traders have already taken it.
{quote} Why is it human nature to turn something simple and make it complex?
Ignored
Dunno, Warren. But I'll be honest; I tried all the wavy line stuff in the beginning, and even had a look at VSA. But it didn't take too long - a year perhaps - for me to start to realise that it is all BS. Price drives everything, so why not go straight to the source and stick with this?
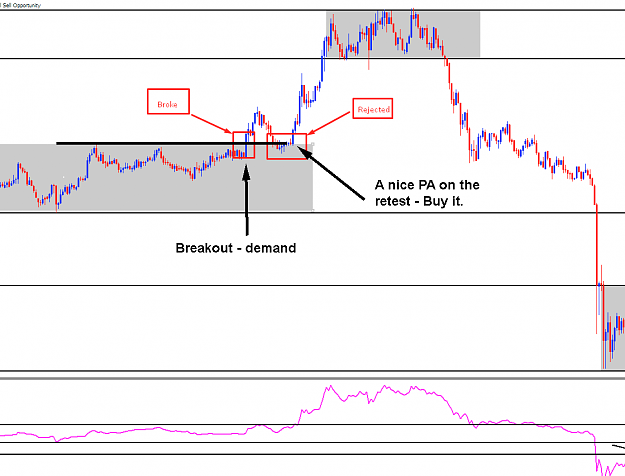
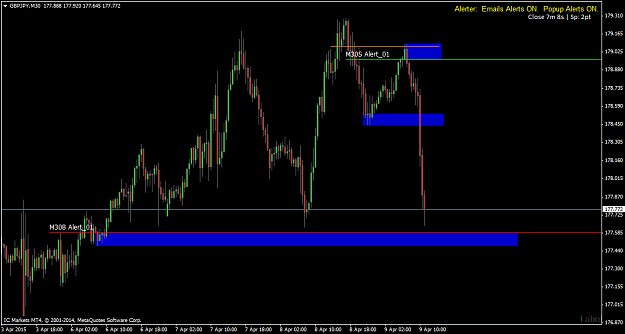
Here is another example, price broke the S/D zone, tried to retrace back in but was rejected {image}
Ignored
Once price break the SD zone the strategy is to enter on the retrace right? Now the question is how to know where price will stop retracing if there are multiple little SD it can bounce from?
And in order not to offend anyone, what is the term you use here to describe a flag that occur just before a break of the SD zone? Also what is the name of the flag that occur just after the break of SD too.
I have always wanted to do well with supply and demand zones, but I tend to not draw them properly. How do you know which zones the big money is looking at and which zones are maybe areas retail traders are looking at? Any advice?
{quote} Once price break the SD zone the strategy is to enter on the retrace right? Now the question is how to know where price will stop retracing if there are multiple little SD it can bounce from? And in order not to offend anyone, what is the term you use here to describe a flag that occur just before a break of the SD zone? Also what is the name of the flag that occur just after the break of SD too.
Ignored
Things to look for
Time of day - this occurred prior to the opening of the USD, with no major news events
Price hit this area 4 times prior (only 3 times showed on the chart)
On the 3rd time, price didnt make the full bounce into high DEMAND area (1.09650) it recovered at the 50% level roughly
This shows weakness with the M-pattern then a W pattern forms, showing strength buyers, buying into the market.
This then creates another tighter channel, it could go either way but then
We get the big push through the supply area, with increased volume
Price remained high but volume fell, this shows most sellers closed positions creating less supply and creating more demand
Also to add in a short time we get
Hammer, shoting star not that, that matters to this discussion it more about realizing the different aspects of the market to look for.
I would also add, Im not sure at this time but would assume the velocity of price was very high, meaning many transactions occurring at this time giving strength
Learn, a forex trader must, unlearn and relearn he will.
{quote} And in order not to offend anyone, what is the term you use here to describe a flag that occur just before a break of the SD zone? Also what is the name of the flag that occur just after the break of SD too.
Ignored
Hey Binyamin,
Honestly, it's not about offending anyone. The idea driving this thread is to try and repair the great damage that a handful of traders have caused others' trading by taking what redsword11 presented in a simplistic way and turning it into something that is _ _ _ _ _ _ (from my side, in order not to cause offence or rustle any feathers I'll leave you to fill in the gaps here).
It's going to be of massive help to people in this thread, myself included, if you can post a simply annotated chart and point some arrows on it to the flag areas that you are referring in order that we can try and resolve this point together.
I have always wanted to do well with supply and demand zones, but I tend to not draw them properly. How do you know which zones the big money is looking at and which zones are maybe areas retail traders are looking at? Any advice?
Ignored
Hi Level2Trader,
In my view, if you start to try and reconcile these two facets of a SD zone then you're only going to be adding a further layer of complexity. It's best to just look out for what appear to be decent zones.
"Decent zones" obviously may be a slightly subjective terms but the best advice I can give you to begin "eye-training" is to start by trading in one TF only and observe the process (price action) that the market enacts when it breaks areas of price (either SR or Swing Points) and continues on a prevailing direction. One way to expedite this process is to use a copy of Forex Tester.
When you're ready, if you wish to post some charts for discussion, please feel free.
{quote} Hi Level2Trader, In my view, if you start to try and reconcile these two facets of a SD zone then you're only going to be adding a further layer of complexity. It's best to just look out for what appear to be decent zones. "Decent zones" obviously may be a slightly subjective terms but the best advice I can give you to begin "eye-training" is to start by trading in one TF only and observe the process (price action) that the market enacts when it breaks areas of price (either SR or Swing Points) and continues on a prevailing direction. One...
Ignored
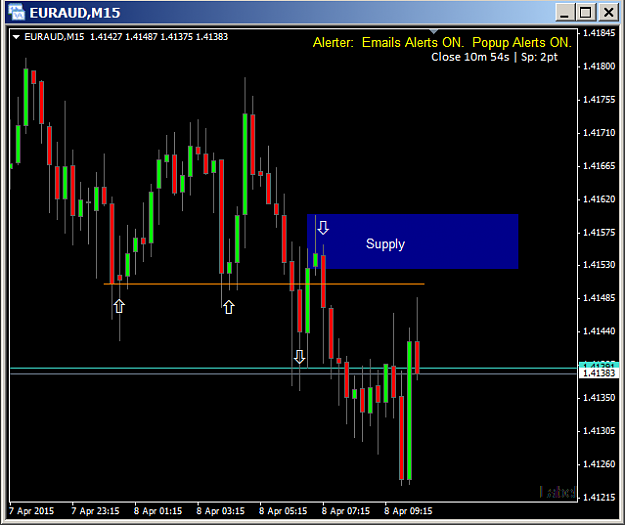
Edit: Here's an example. In my view, retail is not able to create the volume of controlled selling that produced that supply zone.
P.S. Although this chart presents an example of a supply zone I'm cautious about selling this pair on touch-trade and would prefer instead to watch and wait how price reacts.
{quote} Hi Level2Trader, In my view, if you start to try and reconcile these two facets of a SD zone then you're only going to be adding a further layer of complexity. It's best to just look out for what appear to be decent zones. "Decent zones" obviously may be a slightly subjective terms but the best advice I can give you to begin "eye-training" is to start by trading in one TF only and observe the process (price action) that the market enacts when it breaks areas of price (either SR or Swing Points) and continues on a prevailing direction. One...
Ignored
Thank you for the explanation. I appreciate the clarification. So what you are saying (and I agree), is if a big move happens, its not retailers making that move happen. It had to be an institution make the market move
{quote}So what you are saying (and I agree), is if a big move happens, its not retailers making that move happen. It had to be an institution make the market move
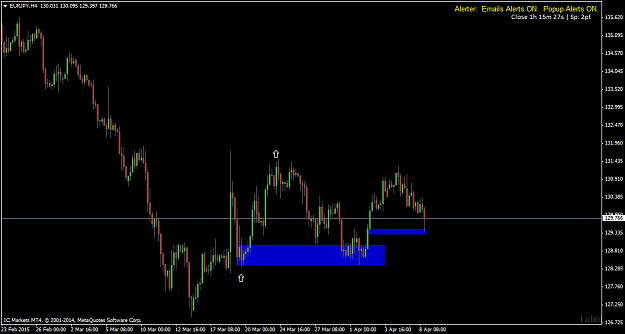
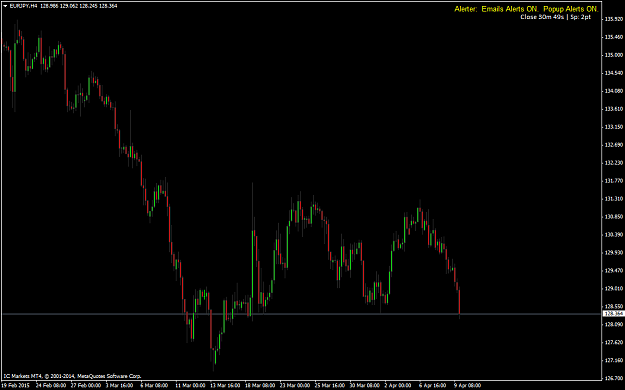
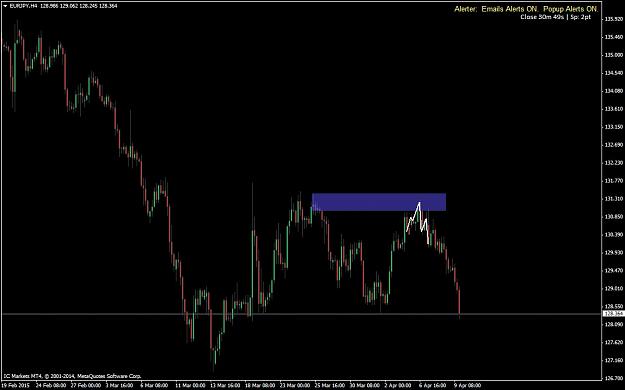
EURJPY H4 One possibility (among many for what this pair may do) for next week. {image}
Ignored
EURJPY
Following on from the earlier post, I'd placed an alert in the H1 TF EJ at 129.50. Alert has recently sounded. Market has already reacted. Am now watching this pair closely to see how things unfold.
Hi Simon ,Famous last words indeed! Greek surprise!! No one could have known this was going to happen when it did!However the market was suggesting down move on the 5 min chart with LL and LH coming away from a 1hr supply back at 0500 gmt. Also the $ index was showing strength.This brings me to the question I have which is, Do you tend to live mostly on the 30 min chart and had you been going into a trade where would you have considered a short and off which time frame? Happy trading
Hi Simon ,Famous last words indeed! Greek surprise!! No one could have known this was going to happen when it did!However the market was suggesting down move on the 5 min chart with LL and LH coming away from a 1hr supply back at 0500 gmt. Also the $ index was showing strength.This brings me to the question I have which is, Do you tend to live mostly on the 30 min chart and had you been going into a trade where would you have considered a short and off which time frame? Happy trading
Ignored
Hi reldas,
Yea, surprise surprise indeed.
The 5AM level you're referring was nice - and had I been awake and trading at 5AM this was the only PA that I'd have happily shorted today, particularly given the context in which it occurred (don't forget that we've got big GBP news today and so it's wise perhaps to maintain a healthy level of suspicion that this down move is a "front run" of that).
In terms of which TF I watch - to be honest, I'm watching all TFs (except M1) for the patterns that I recognise ("any TF any pair" - remember that phrase??? ) I only watch 3 x pairs on intraday though - AUDUSD, EURAUD, GBPJPY.
{quote} EURJPY Following on from the earlier post, I'd placed an alert in the H1 TF EJ at 129.50. Alert has recently sounded. Market has already reacted. Am now watching this pair closely to see how things unfold. {image}
Ignored
OK, EURJPY turned and went on its merry way, short. As per the original post, I had an alarm set and didn't pay any attention to this pair until that alarm went off last night by which time of course, any real hope of a decent swing trade entry was already long gone.
Based on the chart below does anyone wish to add some simple annotation to aid us in what can we learn from the recent PA? Please remember, from my side there's no wrongs or rights, just an individual trader's point of view.
does anyone wish to add some simple annotation to aid us in what can we learn from the recent PA?
Ignored
No response? It doesn't matter.
This is how I see it. Based on the original assessment from on or around 2nd April my analysis would have been the same. On the H4 TF, price was going up so I was thinking of buying. I just set an alarm and didn't look at this pair again until the alarm sounded.
A strange aspect of supply/demand trading is that whenever price is going up, people are thinking of selling. Perhaps it's the way other traders have presented the methodology. Perhaps it's because other traders have routinely only offered about half of the facts regarding supply/demand trading - I don't know. But I spent a couple of years battling my own mindset of being a seller in a rising market. In my view, until a supply/demand trader overcomes and dispenses with this way of thinking, it is not possible to trade in sync with the market.
I wasn't watching this pair every 4 hours, however, if I had been watching it, price began to turn at the supply zone dmostpips had pointed out. Who knows whether or not retail traders would have dived in as soon as price arrived and printed a bearish candle, however, it was only once the market had printed the LL of a QM that I would have considered myself well enough informed that price is going down. It would be then and only then that I would have considered selling.