Let's take all of your trades and plot them on to a chart. Let's plot them on to a time frame that you don't trade. Let's take your methodology from a single frame and see if it translates to another.
Does it?
Or do these look like random positions?
I have been, for the bulk of my forex trading career an M1 trader, but still like to go back and analyze my trades based on the M5, Hourly, H4 charts...to see where and how my trades may have made sense, or perhaps to try and understand where they went wrong.
I have a defined set of rules, that seemingly tip the scales in my favor and have recently taken this translation and extended it to an M5 chart for range and time consideration. A look back on these trades that make sense on the M5, may not make sense on the M1...in fact, in a lot of cases they completely defy the same logic.
Depending on how you see things, this basically makes my trades, Random.
Now, I am a cost averaging fool. Add to my losers, typically based on a bias that my charts tell me. I DO NOT WIN EVERY TRADE, but at the same time, I know when to cut my losses and this isn't by way of an arbitrary Stop Loss Value.
The market and my trade pairs play inside of what I consider dynamic ranges, meaning that setting an arbitrary value of -20, or -50, may be relevant to one, but certainly doesn't translate to the rest...It'd be foolish, IMO, to allow a trade to carry on in the wrong direction of my technical bias, when I could just jump on to the favor of the actual trend...cut losses and make back a portion on profit.
Now, these too, don't always pan out. I can enter into a position that turns bad, exit and flip sides only to lose a second time, sometimes this has carried me into 4-5 consecutive losing trades. I am not a big fan of these days...
Anyways...
In cost averaging, you have to make a decision on the size of the add to your trade, and I am a bit of a fan of a martingale style add, in that my subsequent positions are larger than my primary. Be it, step them incrementally or with the use of a 1.5-2x multiplier and carry these to a hopefully net positive position.
So...this weekend and with the help of some stats from last weeks trading data, I made a simple modification to a Martingale strategy that seemingly takes position on a weighted coin.
By application to a Renko Brick chart, what I am effectively doing is using an indicator base and a pure martingale, to double down on positions on overbought and oversold and have applied this to several pairs across the market.
The weighted coin...if you were at a roulette wheel and started off with a single lot on black, and doubled down until you won, how many levels could you go? If you waited until you seen 4x red in a row, wouldn't this actually increase the probability of success?
Same in betting on a weighted coin. If you were to start to bet on heads or tails consistently and waited until you seen 4 heads come up in a row, would it be a reasonable guess to start wagering on Tails and doubling down from there?
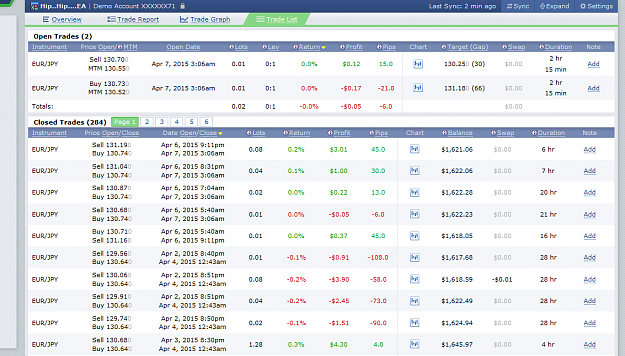
I am not going to go through the math of this, but will drop down the Trade Explorer and watch as this plays out.
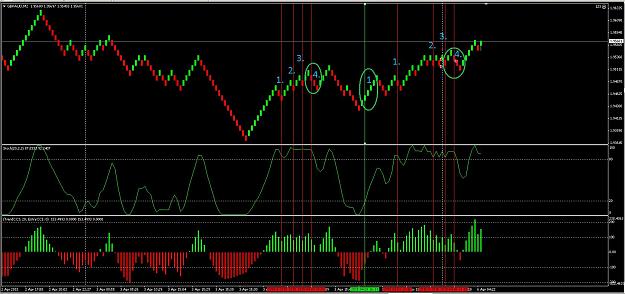
Rules are like this...
If Stochs are overbought, and CCI wass greater than 100, and is now less than 100, sell.
If Stochs are oversold, and CCI was less than -100, and is now greater than -100, buy.
Stop loss, 20.
Take profit, 20.
Martingale factor of 2.0.
I am working somewhat based on an old thread by RR, check it out in post 1, HERE.
Now, go back through your history on martingales and see how much risk is involved with this general principle, certainly nothing that I'd drop real funds on...(well, not initially), but over time, is there an actual trade set that will allow the idea to prosper based on a weighted coin toss?
Does it?
Or do these look like random positions?
I have been, for the bulk of my forex trading career an M1 trader, but still like to go back and analyze my trades based on the M5, Hourly, H4 charts...to see where and how my trades may have made sense, or perhaps to try and understand where they went wrong.
I have a defined set of rules, that seemingly tip the scales in my favor and have recently taken this translation and extended it to an M5 chart for range and time consideration. A look back on these trades that make sense on the M5, may not make sense on the M1...in fact, in a lot of cases they completely defy the same logic.
Depending on how you see things, this basically makes my trades, Random.
Now, I am a cost averaging fool. Add to my losers, typically based on a bias that my charts tell me. I DO NOT WIN EVERY TRADE, but at the same time, I know when to cut my losses and this isn't by way of an arbitrary Stop Loss Value.
The market and my trade pairs play inside of what I consider dynamic ranges, meaning that setting an arbitrary value of -20, or -50, may be relevant to one, but certainly doesn't translate to the rest...It'd be foolish, IMO, to allow a trade to carry on in the wrong direction of my technical bias, when I could just jump on to the favor of the actual trend...cut losses and make back a portion on profit.
Now, these too, don't always pan out. I can enter into a position that turns bad, exit and flip sides only to lose a second time, sometimes this has carried me into 4-5 consecutive losing trades. I am not a big fan of these days...
Anyways...
In cost averaging, you have to make a decision on the size of the add to your trade, and I am a bit of a fan of a martingale style add, in that my subsequent positions are larger than my primary. Be it, step them incrementally or with the use of a 1.5-2x multiplier and carry these to a hopefully net positive position.
So...this weekend and with the help of some stats from last weeks trading data, I made a simple modification to a Martingale strategy that seemingly takes position on a weighted coin.
By application to a Renko Brick chart, what I am effectively doing is using an indicator base and a pure martingale, to double down on positions on overbought and oversold and have applied this to several pairs across the market.
The weighted coin...if you were at a roulette wheel and started off with a single lot on black, and doubled down until you won, how many levels could you go? If you waited until you seen 4x red in a row, wouldn't this actually increase the probability of success?
Same in betting on a weighted coin. If you were to start to bet on heads or tails consistently and waited until you seen 4 heads come up in a row, would it be a reasonable guess to start wagering on Tails and doubling down from there?
I am not going to go through the math of this, but will drop down the Trade Explorer and watch as this plays out.
Rules are like this...
If Stochs are overbought, and CCI wass greater than 100, and is now less than 100, sell.
If Stochs are oversold, and CCI was less than -100, and is now greater than -100, buy.
Stop loss, 20.
Take profit, 20.
Martingale factor of 2.0.
I am working somewhat based on an old thread by RR, check it out in post 1, HERE.
Now, go back through your history on martingales and see how much risk is involved with this general principle, certainly nothing that I'd drop real funds on...(well, not initially), but over time, is there an actual trade set that will allow the idea to prosper based on a weighted coin toss?
Money Can't Buy Happiness. Poverty Can't Buy SHIT! You Choose!