UPDATED with an actual Indicator
I've come up with a slightly modified interpretation of the 'Escalator to Pips' Strategy.
My Template and first indicator are slightly modified versions of the template / indicators Banzai posted in post 13 on the first page.
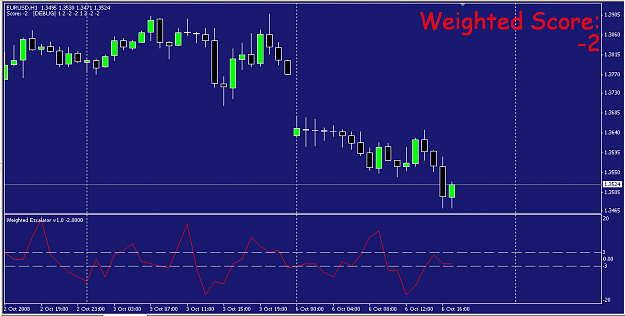
The new indicator is a small graph with a the current score.
I call it the 'Weighted Escalator'
In this template, there are a total of 8 bars. The first 4 are the M15, M30, H1 and H4 stoch's with a 5,3,3 setting. The second set of 4 are M15, M30, H1 and H4 stoch's with a 14,3,3 setting.
I read this chart by giving the H4 chart the most weight in my calculations (since it is the trend) than the H1 which is still weighted more than the M30, then the M15. You add and subtract the scores of each chart to get a total for that bar. You buy when the bar total goes above 3. You sell when it goes below -3.
The scoring is done like this:
M15 charts:
SpringGreen = +1
LimeGreen = 0
FireBrick = 0
IndianRed = -1
M30 Charts:
SpringGreen = +2
LimeGreem = 0
FireBrick = 0
IndianRed = -2
H1 Charts:
SpringGreen = +2
LimeGreen = +1
FireBrick = -1
IndianRed = -2
H4 Charts:
SpringGreen = +4
LimeGreen = +2
FireBrick = -2
IndianRed = -4
Total up the score for each bar. The score can be graphed much like a moving average, but I just use my fingers to see what the score is. I do sometimes plot the scores on some graph paper for analysis.
WHEN TO BUY:
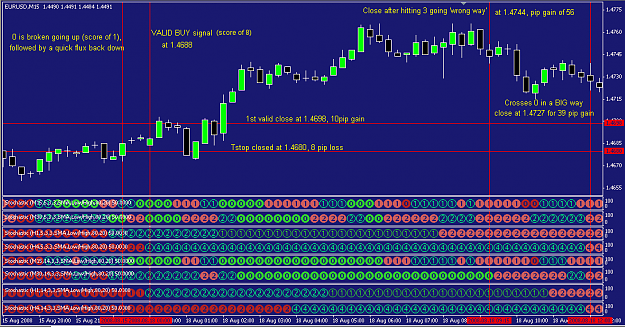
Buy when the scoring goes from a negative number, past the zero, then hits the 3 or more. Example, the score goes -8, -5, -9, -1, 0, 1, 2, -1, 0, 2, 3 [BUY]
WHEN TO SHORT:
Buy when the scoring goes from a positive number, past the zero, then hits the -3 or less. Example, the score goes 13, 4, 12, 5, 6, 0, -2, -1, -2, 0, 1, 2, -5 [SHORT]
WHEN TO CLOSE
===============
Upon Buying or Selling, I open 4 positions (lot size of your choice) with a stop loss if you want. I close each at the following:
1st. Take profit at 10 pips
2nd. Trailing Stop of 15 pips
3rd. This is my 'other' lot. Close when you like, I close after the 1st and 2nd have closed and it hit's or crosses the 3 going the 'wrong' way (I recently decided that is is my favorite out)
4th. Close when the score hit's or passes 0
================
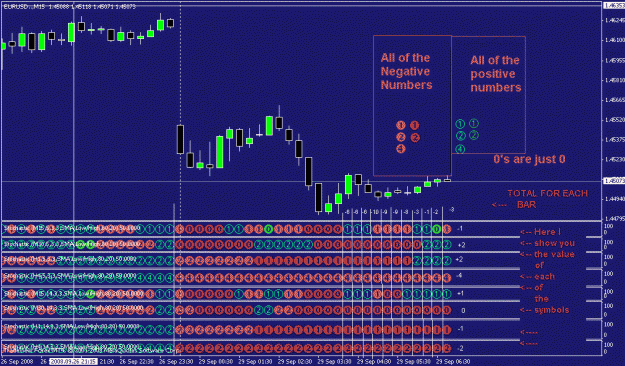
So far, I've done this charting by hand on several past months and it's proven profitable for me. Looking at the chart below, you read the symbols like so:
a positive number is the number that's not filled in, a negative number is the one that's filled in. Also, the greens are positive, the reds are negative.
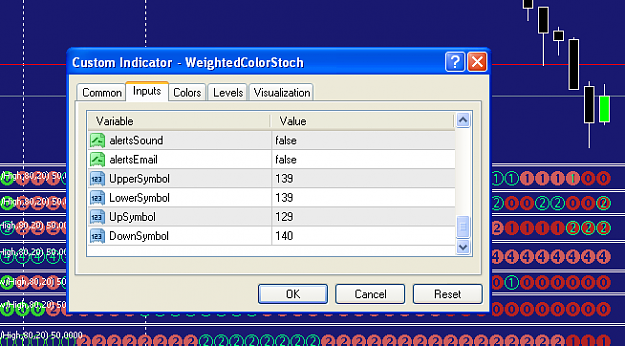
I have now attached my modified template and indicator.
Attached File(s)


