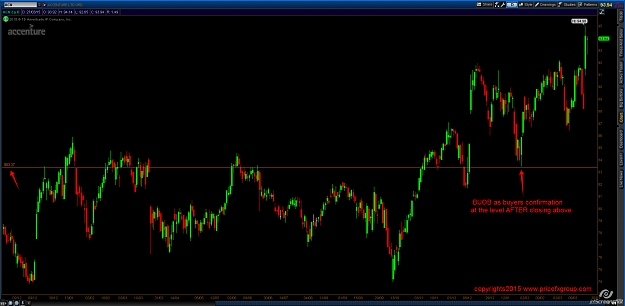
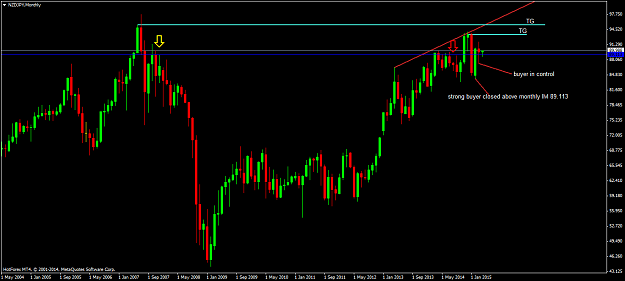
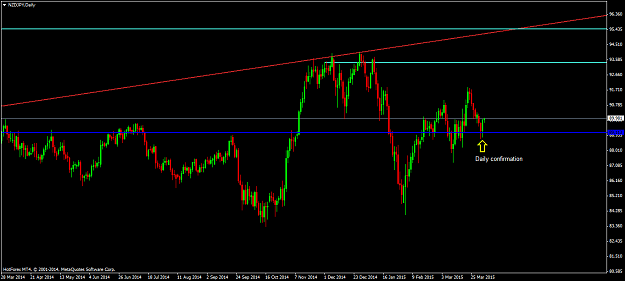
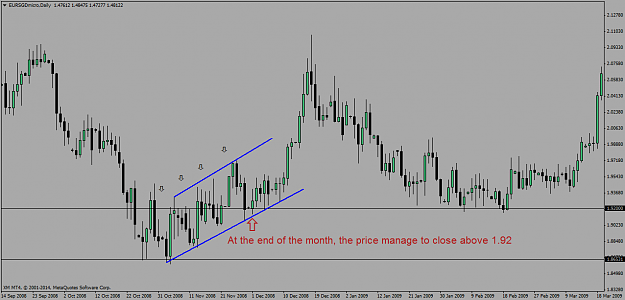
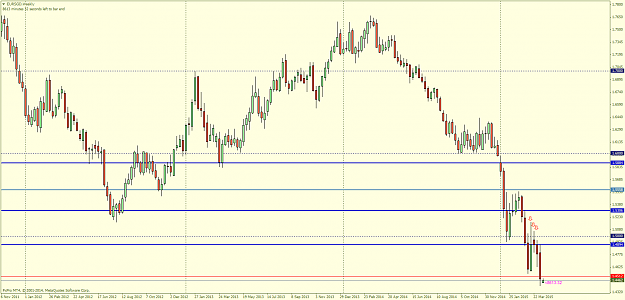
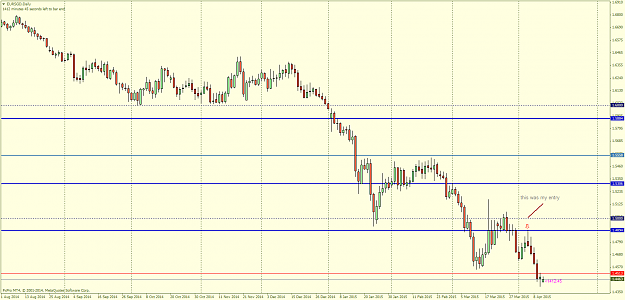
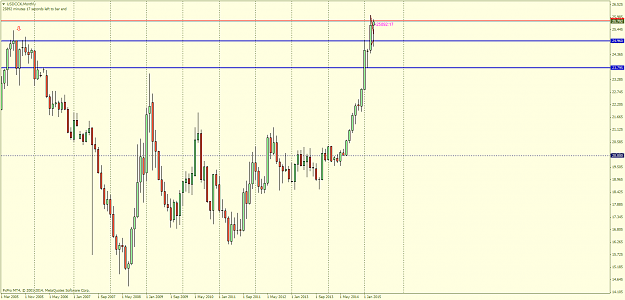
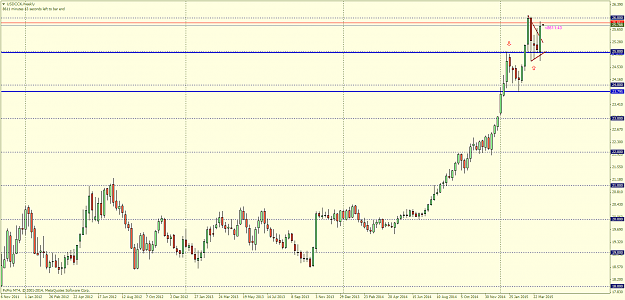
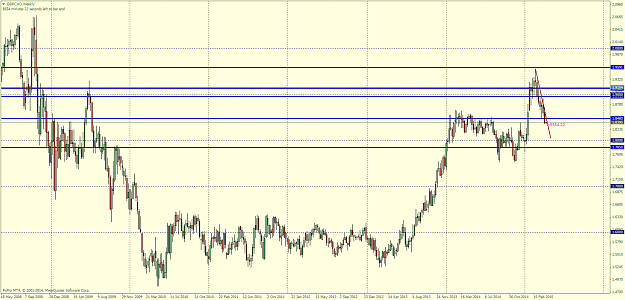
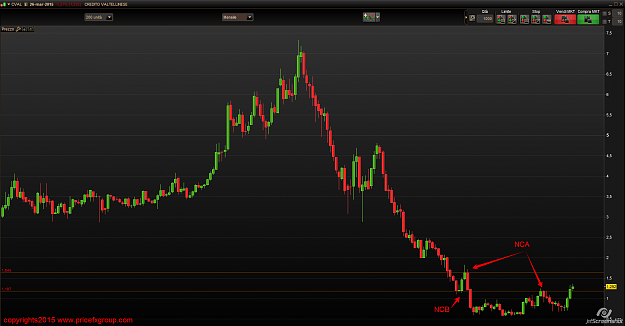
Here is an example of a clear market situation that respect the methodology WPD+WPG....CVAL ( italian stock ) ...the last monthly candle closed above the 1.18 and we notice how this month the P did RET exactly to the level we expected ( WPD )...a buyers confirmation at the level, will push the P higher to the 1.64 R (WPG ) .
Please notice how the S / R levels are very clear and the P respected exactly the identyfied levels....over the time,this kind of situation became an important selection criteria for me !
Attached Image (click to enlarge)
Nothing personal,just business