• Home
  • Forums
  • Trades
  • News
  • Calendar
  • Market
  • Brokers
  • Login
  • Join
  • User/Email: Password:
  • 7:35am
Menu
  • Forums
  • Trades
  • News
  • Calendar
  • Market
  • Brokers
  • Login
  • Join
  • 7:35am
Sister Sites
  • Metals Mine
  • Energy EXCH
  • Crypto Craft

Options

Bookmark Thread

First Page First Unread Last Page Last Post

Print Thread

Similar Threads

M candles / Custom candles for second charts 1 reply

Calculating only buy candles vs sell candles 2 replies

Platform which enables the rewinding of candles 3 replies

Missing candles? 1 reply

I need more candles! 4 replies

  • Commercial Content
  • /
  • Reply to Thread
  • Subscribe
  • 2,054
Attachments: Beyond the Candles
Exit Attachments
Tags: Beyond the Candles
Cancel

Beyond the Candles

  • Last Post
  •  
  • 1 110111Page 112113114 126
  • 1 Page 112 126
  •  
  • Post #2,221
  • Quote
  • Mar 4, 2015 9:15pm Mar 4, 2015 9:15pm
  •  kellychem
  • | Joined Feb 2015 | Status: Member | 17 Posts
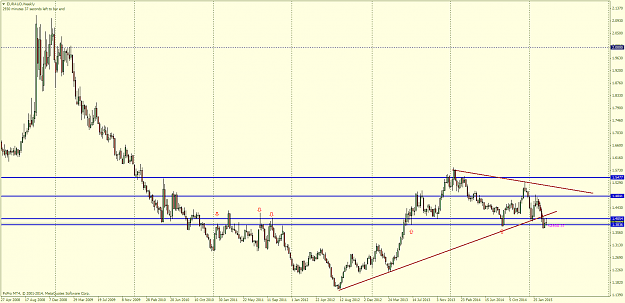
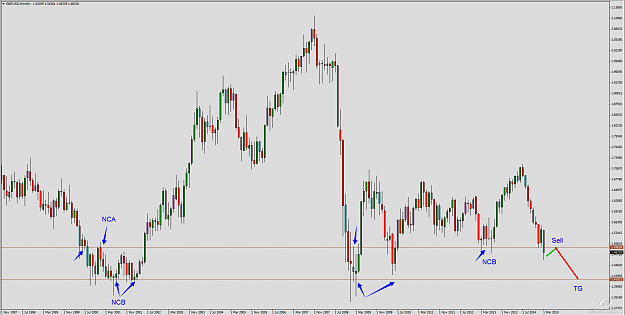
hi, fxgroup, your answer was highly appreciated, if there were month -line drawed. then we should wait for the month bar close as confirmation. and ingore the week close. take the picture i uploaded as example. i alreadly had month-line drawed on the P 1183, then even if the weekly bar had close below the P 1183, we should ingore it, and wait for the monthly bar close for confirmation. could i say. "when the weekly line was close or near the monthly line, we should ingore the week bar close, and pay attention to monthly bar close for HF confirmation." expect your feedback.
 
 
  • Post #2,222
  • Quote
  • Edited 9:50pm Mar 4, 2015 9:22pm | Edited 9:50pm
  •  kellychem
  • | Joined Feb 2015 | Status: Member | 17 Posts
just wait for AG month bar close below the RN 16.00.
Attached Image (click to enlarge)
Click to Enlarge

Name: XAGUSDproMonthly.png
Size: 52 KB
 
 
  • Post #2,223
  • Quote
  • Mar 4, 2015 9:39pm Mar 4, 2015 9:39pm
  •  kellychem
  • | Joined Feb 2015 | Status: Member | 17 Posts
HI , fxgroup, the line i drawed on CHF right?
Attached Image (click to enlarge)
Click to Enlarge

Name: USDCHFMonthly.png
Size: 57 KB
 
 
  • Post #2,224
  • Quote
  • Mar 4, 2015 9:47pm Mar 4, 2015 9:47pm
  •  kellychem
  • | Joined Feb 2015 | Status: Member | 17 Posts
Clean and simple , just wait for the week bar close beyong the line & take action . Wow.
Attached Image (click to enlarge)
Click to Enlarge

Name: UK_OILDaily.png
Size: 48 KB
 
 
  • Post #2,225
  • Quote
  • Mar 4, 2015 10:08pm Mar 4, 2015 10:08pm
  •  kellychem
  • | Joined Feb 2015 | Status: Member | 17 Posts
hi, fxgroup , as for gold , should i wait for the month bar close below the 1177 as HF confirmation for sell.
Attached Image (click to enlarge)
Click to Enlarge

Name: XAUUSDproMonthly.png
Size: 52 KB
 
 
  • Post #2,226
  • Quote
  • Mar 4, 2015 10:15pm Mar 4, 2015 10:15pm
  •  kellychem
  • | Joined Feb 2015 | Status: Member | 17 Posts
a clean picture i watched closely for cotton, just wait for the monthly bar close above the 0.68.
Attached Image (click to enlarge)
Click to Enlarge

Name: COTTONMonthly.png
Size: 46 KB
 
 
  • Post #2,227
  • Quote
  • Mar 5, 2015 6:16am Mar 5, 2015 6:16am
  •  fxgroup
  • | Commercial Member | Joined Nov 2010 | 1,178 Posts
Quoting kellychem
Disliked
just wait for AG month bar close below the RN 16.00. {image}
Ignored
The silver is at strong dynamic S level and the dicember doji as CB, are telling us that we are in the middle of a battle betwen buyers and sellers forming a RM..very often when the P is betwen 2 strong level, it starts forming RMs !
Attached Image (click to enlarge)
Click to Enlarge

Name: SI.png
Size: 70 KB
Nothing personal,just business
 
 
  • Post #2,228
  • Quote
  • Mar 11, 2015 3:17am Mar 11, 2015 3:17am
  •  fxgroup
  • | Commercial Member | Joined Nov 2010 | 1,178 Posts
Hi Kelly...regarding the gold..it is obvious that it is in a very strong bearish trend and my plan is very simple: I will wait for the P to close below the 1154+ its confirmation as R in order to sell it till the 1110 as the first MM level and 1073 as first important Tg
Attached Image (click to enlarge)
Click to Enlarge

Name: Gold.png
Size: 41 KB
Nothing personal,just business
 
 
  • Post #2,229
  • Quote
  • Mar 12, 2015 10:10am Mar 12, 2015 10:10am
  •  fxgroup
  • | Commercial Member | Joined Nov 2010 | 1,178 Posts
Quoting fxgroup
Disliked
TCO....if it closes below the 71.68 then the 63 becomes the main TG {image}
Ignored
Do you remember this chart...look how the level acted as S.....every RM has a ML ( middle level ) where we aleays see stron price reactions ..let's see it today
Attached Image (click to enlarge)
Click to Enlarge

Name: tco.png
Size: 64 KB
Nothing personal,just business
 
 
  • Post #2,230
  • Quote
  • Mar 13, 2015 4:54am Mar 13, 2015 4:54am
  •  fxgroup
  • | Commercial Member | Joined Nov 2010 | 1,178 Posts
The chart of this post shows how important is keeping the simplicity in trading....one of my trading method ( and one of the safiest ) is waiting for the price to close above / below a strong RM ( consolidation ) and a RET on it + its confirmation as S / R...obviously...I always prefer trading with the main trend.

Look on the chart WHERE the price retraced and how it acted at the identifyied levels...REMEMBER...stronger the RM ( consolidation ) is, stronger the level and stronger the P's reaction will be and of course safer too !

Attached Image (click to enlarge)
Click to Enlarge

Name: EIX.png
Size: 63 KB


Attached Image (click to enlarge)
Click to Enlarge

Name: EIX-D.png
Size: 70 KB
Nothing personal,just business
 
 
  • Post #2,231
  • Quote
  • Mar 16, 2015 6:27am Mar 16, 2015 6:27am
  •  fxgroup
  • | Commercial Member | Joined Nov 2010 | 1,178 Posts
The FTSE MIB index with the P that is reaching the static RM's R...notice how the most important R levels turded into S once the P close above them...but not only...notice also how the P reacted and gave us a good opportunity with the bullish PB as DB ( double bottom ) confirmation on D chart

Attached Image (click to enlarge)
Click to Enlarge

Name: FTSE MIB.png
Size: 66 KB


Attached Image (click to enlarge)
Click to Enlarge

Name: MIB-D.png
Size: 43 KB
Nothing personal,just business
 
 
  • Post #2,232
  • Quote
  • Mar 18, 2015 5:15am Mar 18, 2015 5:15am
  •  fxgroup
  • | Commercial Member | Joined Nov 2010 | 1,178 Posts
Some hints about the way I read the price

Inserted Video
Nothing personal,just business
 
 
  • Post #2,233
  • Quote
  • Mar 19, 2015 3:21pm Mar 19, 2015 3:21pm
  •  fxgroup
  • | Commercial Member | Joined Nov 2010 | 1,178 Posts
USDCAD is still in RM at its R level..very interesting how the P respect the NCA+NCB concept
Attached Image (click to enlarge)
Click to Enlarge

Name: USDCAD.png
Size: 55 KB
Nothing personal,just business
 
 
  • Post #2,234
  • Quote
  • Mar 19, 2015 6:58pm Mar 19, 2015 6:58pm
  •  Thenew
  • | Joined Dec 2007 | Status: Member | 186 Posts
Hi FXGROUP, thanks for the video very helpful for my learning.
 
 
  • Post #2,235
  • Quote
  • Mar 20, 2015 8:36am Mar 20, 2015 8:36am
  •  fxgroup
  • | Commercial Member | Joined Nov 2010 | 1,178 Posts
Welcome....put some higher time frame charts and let's look together where the P did its RET on D chart and how it react at that level also !
Nothing personal,just business
 
 
  • Post #2,236
  • Quote
  • Mar 25, 2015 6:30pm Mar 25, 2015 6:30pm
  •  fxgroup
  • | Commercial Member | Joined Nov 2010 | 1,178 Posts
EURAUD....we can clearly see the H&S pattern what is forming but having the monthly candle still in act, we have to wait to see if it will close below the neck-line and then a RET+ sellers confirmation at the level or the buyers will be able to keep the level control and the 1.4047 will still act as S.
Remember...in order to trade a pattern we always must have its confirmation !
Attached Image (click to enlarge)
Click to Enlarge

Name: EURAUD.png
Size: 44 KB
Nothing personal,just business
 
 
  • Post #2,237
  • Quote
  • Mar 26, 2015 9:03am Mar 26, 2015 9:03am
  •  fxgroup
  • | Commercial Member | Joined Nov 2010 | 1,178 Posts
Stock thaughts

The RM is the most important market structure , most of its time the P is consolidating in range so that’s why is so important to learn it and study how to manage the RM and especially the ways to trade within and out of it.
In this video I speak about a stock title ( TCO ) where the P is stuck in RM and how I PTT&TTP ( plan the trade & trade the plan ) based on this market’s structure with its caracteristics

Inserted Video
Nothing personal,just business
 
 
  • Post #2,238
  • Quote
  • Mar 26, 2015 10:35am Mar 26, 2015 10:35am
  •  fxgroup
  • | Commercial Member | Joined Nov 2010 | 1,178 Posts
The M close will give us the information about WPD+WPG...but only if it iwll close below the 1.4963 level..remember the candle's close is only an information and a trade based only on information has a higher risk...in order to trade safety we must wait for the RET on the level + sellers confirmation at the R level
Attached Image (click to enlarge)
Click to Enlarge

Name: GU.png
Size: 60 KB
Nothing personal,just business
 
 
  • Post #2,239
  • Quote
  • Mar 26, 2015 11:39am Mar 26, 2015 11:39am
  •  Tp-link
  • | Joined May 2013 | Status: Member | 21 Posts
tq fxgroup for your great video.
 
 
  • Post #2,240
  • Quote
  • Mar 26, 2015 5:14pm Mar 26, 2015 5:14pm
  •  Beertje
  • | Joined Oct 2011 | Status: Member | 446 Posts
Quoting fxgroup
Disliked
EURAUD....we can clearly see the H&S pattern what is forming but having the monthly candle still in act, we have to wait to see if it will close below the neck-line and then a RET+ sellers confirmation at the level or the buyers will be able to keep the level control and the 1.4047 will still act as S. Remember...in order to trade a pattern we always must have its confirmation ! {image}
Ignored
Thanks your post! I have a question, I see a strong line below your line. I think today can the daily make an entry signal, but the next line can stop it. What do you think about this?
Attached Image (click to enlarge)
Click to Enlarge

Name: EURAUDWeekly.png
Size: 75 KB
 
 
  • Commercial Content
  • /
  • Beyond the Candles
  • Reply to Thread
    • 1 110111Page 112113114 126
    • 1 Page 112 126
0 traders viewing now
  • More
Top of Page
  • Facebook
  • Twitter
About FF
  • Mission
  • Products
  • User Guide
  • Media Kit
  • Blog
  • Contact
FF Products
  • Forums
  • Trades
  • Calendar
  • News
  • Market
  • Brokers
  • Trade Explorer
FF Website
  • Homepage
  • Search
  • Members
  • Report a Bug
Follow FF
  • Facebook
  • Twitter

FF Sister Sites:

  • Metals Mine
  • Energy EXCH
  • Crypto Craft

Forex Factory® is a brand of Fair Economy, Inc.

Terms of Service / ©2023