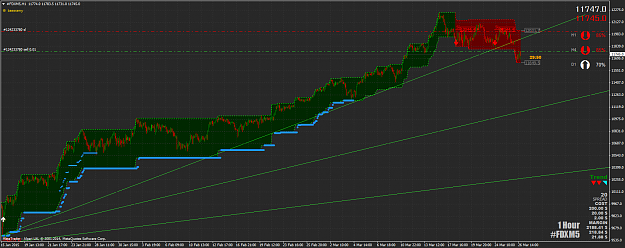
{quote} Yeah, u can laugh @ me as much as u want guys, if u r that blonde in the picture than u r welcome to visit me in jail as much as u want but be sure to wear a bikini next time . {image}
Hmmmm.......Bass how did you get thrown in the FF clink? What did they say you did?
Ignored
They said when i contacted them about this issue that i'm promoting some kind of services and i was playing against the rules, the fact is that i was just sharing here some of my daily research as i always do and still doing.
{quote} They said when i contacted them about this issue that i'm promoting some kind of services and i was playing against the rules, the fact is that i was just sharing here some of my daily research as i always do and still doing. Thank you for asking anyway. Best, B.R.
Ignored
I guessed as much. What FF does not like is when posters share charts but do not give the means of duplicating those charts. That leads them to think that you are trying to get people to PM you, so that you can move them off site and sell them the missing pieces that you have chosen not to share in your posts here.
That really seems to tick them off.
Glad that you share your research, but to FF if you do not give the source of your research so that others can duplicate it, then you are fishing for folks who are willing to pay for that.
Otherwise you always post great stuff, and am looking forward to hearing more. You are the only commercial member that I have subbed. You give quality stuff. Keep it up!
If you are good at something, never do it for free--Joker
{quote} I guessed as much. What FF does not like is when posters share charts but do not give the means of duplicating those charts. That leads them to think that you are trying to get people to PM you, so that you can move them off site and sell them the missing pieces that you have chosen not to share in your posts here. That really seems to tick them off. Glad that you share your research, but to FF if you do not give the source of your research so that others can duplicate it, then you are fishing for folks who are willing to pay for that. Otherwise...
Ignored
Thank you for ur nice words, the fact is all that i share here is floating freely on the Net if you know where to look, i only summarize it here and use my thread like a journal to keep the important stuff in reach in case i needed something pronto, besides i like to note everything important to me for it clears my mind and let me look at things in different and multiple dimensions and perspectives.
Michael Covel@Covel If your trading at home or office looks like this...my guess is that you have ceased reality and of course sex. {image}
Ignored
Lol.. that looks like a pretty crazy set-up..I'm not sure all those monitors would fit on my desk .. I suppose it all comes down to whatever earns you money though...the rest is irrelevant..
Joined Apr 2011
|
Status: Cut Your Losses, Ride Your Winners.
|2,914 Posts
10 Ways A Trader Can Diversify Their Life
You have power over your mind – not outside events. Realize this, and you will find strength.” – Marcus Aurelius
The weakest part of any trading system is the trader themselves.
To be a successful trader, you must manage yourself. The ability to manage your own physical, emotional, mental, and spiritual health will go a long way in determining if you can maintain the energy and drive that it takes to be a consistently profitable trader, over long periods of time. Like so many other areas of life, I suspect that over 90% of traders fail to be profitable because they fail to manage themselves. They fail as traders because self control and self discipline are the key traits of a successful trader.
So much is written about the dangers of financial ruin because of trading too big, but little is written about the risk of emotional and mental ruin by trading too much, or without a balanced life. A trader can still make a comeback after blowing up a trading account, but there is no coming back from personal ruin and permanent loss of hope and belief in themselves as a competent trader.
You must run your trading like a business, scheduling your “on” and “off” hours. This includes your family, who should know when you are available and focused on them. You must always be sure to schedule quality time with your significant other, children, friends, and family for optimum emotional health.
You need to have hobbies, recreation, and games that help you forget you are a trader for awhile; allowing you to recharge your batteries and return refreshed and ready to trade.
You must be able to leave your trading results at the trading desk, and not allow them to bleed into your personal life. The best way to do this is to trade a position size that keeps your emotions manageable.
A trader needs a diversified life, with trading as just one part of it. Having a healthy family life, friends, hobbies, exercise, and good nutrition leads to a balanced personal portfolio of time and energy. This helps to keep trading in perspective.
Having a great group of trading friends helps you remember that you are not alone, and that others share your journey as a trader. The camaraderie is very healthy, and it is great to have someone that understands your ups and downs.
Your significant other needs to have the confidence and faith in you, that we will be successful in trading. They need to understand the risks involved in trading, and our money management and our winning percentage. It is still the trader’s job to ensure the family’s needs are taken care of through the proper safety nets. Most traders will make a living and pay bills by other means.
Only a trader’s passion and work ethic will take them the distance. Trading is not for everyone, but it can be richly rewarding for those that put in the time and run the race with all their heart, focus, perseverance, and drive. We must remember that we trade to create a great life, and not live to trade.
A trader needs a spiritual aspect of their life to keep them centered. Whether it is a belief in a higher power, prayer, mediation, or mindfulness. A trader has to have access to a part of themselves that is much bigger than trading.
It is not trading or profits that make us better people, as much as the lessons and principles we learn from our trading, that can help to strengthen all areas of our lives, and make us whole.
February 3, 2015 Courtesy of STEVE BURNS ·NEW TRADER U
Joined Apr 2011
|
Status: Cut Your Losses, Ride Your Winners.
|2,914 Posts
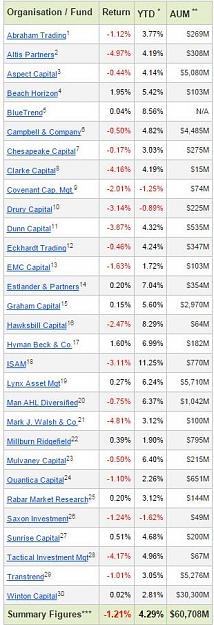
Trend Following Wizards – February
March 27th, 2015
Not a great month. Neither for the Wizards or for this blog, with such a long delay publishing this month’s report. Apologies for reporting the February figures so close to… April. For various reasons I was unable to get to this earlier than now. Here it is finally.
A negative return, but only slightly. This allowed for the composite figure to stay well in the black for the year. A negative month, but still positive overall…
February: -1.21%
YTD: +4.29%
1 – Abraham Trading was founded by Salem Abraham, after he was introduced to Managed Futures and Trend Following by Jerry Parker. He is considered as a “second-generation” Turtle. Program tracked: Diversified Program.
2 – Altis Partners started trading in 2001 and now manage over a $1B with their Altis Global Futures Portfolio. The figures referenced in the performance table are not provided by Altis Partners and no reliance should be taken as to their accuracy, and as a consequence the figures may not be in accordance with any CFTC / NFA performance reporting requirements. Program tracked: Global Futures Portfolio.
3 – The four founders of Aspect (Eugene Lambert, Anthony Todd, Michael Adam and Martin Lueck) were significant members of one of the most successful funds in managed futures – AHL (Adam, Harding and Lueck). Program tracked: Aspect Capital Diversified Program.
4 – Beach Horizon was created as a fully automated trend following subsidiary of Beach Capital Mgt, founded by David Beach. Two of the founders of Beach Horizon had early involvement in AHL. Program Tracked: Managed Account.
5 – BlueTrend, from BlueCrest Capital, is one of the largest Trend Following funds – headed by Ms. Leda Braga. Program tracked: BlueTrend Fund Limited (GBP).
6 – Campbell & Company is one of the oldest Trend Following firms, operating for around 4 decades. Program tracked: Global Diversified Large.
7 – Chesapeake Capital was founded by Jerry Parker, a former Turtle. Program tracked: Diversified Program.
8 – Clarke Capital was founded by Michael Clarke in 1993. Program tracked: Millenium Program.
9 – Covenant Capital is a CTA from Nashville. Program tracked: Aggressive Program
10 – Drury Capital, Inc., was founded in Illinois in 1992 by Bernard Drury. Program tracked: Diversified Trend-Following.
11 – Dunn Capital was founded by Bill Dunn. Program tracked: World Monetary and Agriculture (WMA).
12 – Eckhardt Trading is the firm managed by William Eckhardt, who co-led the Turtle experiment with Richard Dennis. Program tracked: Standard Program.
13 – EMC Capital was founded by Liz Cheval, a former Turtle. Program tracked: EMC Classic Program.
14 – Estlander is a Finnish CTA, founded by Martin Estlander. Program tracked: Alpha Trend.
15 – Graham Capital was founded in 1994 by Ken Tropin, previously a Director of JWH. Program tracked: K4-D10.
16 – Hawksbill Capital was founded by Tom Shanks, a former Turtle. Program tracked: Global Diversified Program.
17 – Hyman Beck & Co. main principals are Alexander Hyman and Carl Beck. Program tracked: Global Portfolio.
18 – ISAM’s main individuals are Larry Hite and Stanley Fink, both instrumental in the success of MAN AHL. Program tracked: ISAM Systematic Fund Class A
19 – Lynx Asset Management is a multi-billion CTA out of Sweden. Program tracked: Lynx Program
20 – Originally ED & F Man, a commodities broker business founded in 1783. Man became a succesful CTA starting in 1983, when partnering with Larry Hite’s Mint Investments. Subsequently Man gradually acquires AHL (1989-1994) to form Man AHL: the systematic trading division of the Man group. Program tracked: Man AHL Diversified Plc
21 – Mark J. Walsh was not an official Turtle but trained and worked closely with Richard Dennis before starting his own fund management business. Program tracked: Standard Program.
22 – Millburn Ridgefield have been trading Trend Following models since the early 1970’s. Program tracked: Diversified Program.
23 – Mulvaney Capital Management was founded in 1999 by Paul Mulvaney and focuses on long-term trend following. Program tracked: Mulvaney Global Markets
24 – Program tracked: Managed Futures Program
25 – Rabar Market Research is the company of Paul Rabar, a former Turtle. Program tracked: Diversified Program.
26 – Saxon Investment was founded by Howard Seidler, a former Turtle. Program tracked: Aggressive Diversified Program.
27 – Sunrise Capital is a CTA based in San Diego. Founded in 1980 by Gary Davis, it merged in 1995 with Commodity Commodity Monitors, Inc., founded by Rick Slaughter in 1977. Program tracked: Sunrise Evolution
28 – Tactical Investment Management was founded by David Druz, student of Ed Seykota.
Program tracked: Institutional Commodity Program.
29 – Transtrend is a Trend follower CTA based in Netherlands.
Program tracked: DTP – Enhanced Risk (USD).
30 – Winton Capital is a London-based CTA founded by Dave Harding (also co-founder of AHL).
Program tracked: Diversified Program.
Joined Apr 2011
|
Status: Cut Your Losses, Ride Your Winners.
|2,914 Posts
Language reveal thoughts that reveal Mindsets, Listen to your words and detect beforehand your Mindset and learn to correct mistakes before they happens or @ least try to avoid them altogether.
Joined Apr 2011
|
Status: Cut Your Losses, Ride Your Winners.
|2,914 Posts
This is so important that i had to share it here.
The Traders Math Guide Everything You Need To Know About Math And Statistics
In todays world, math and statistics are not very popular and most people dont even understand basic mathematical and statistical concepts. Whereas in most professions you can still find a way to work around your lack of knowledge, if you fail to understand or misunderstand math and statistics in trading, it is very hard to trade profitably.
In the following math guide for traders we will provide you with a crash course of the most important mathematical concepts and explain how they affect your trading. To give you a little overview, this article includes the following concepts:
Financial instruments move in Pips and an appreciation of 1 pip means that the instrument is rising 0.0001 units or points (Yen pairs are an exception 1 pip equals 0.01 points).
The EUR/USD exchange rate is currently 1.2520 and if the EUR/USD rises to 1.2530, it equals an appreciation of 10 pips. Some brokers quote their pips in the so called pipettes where 1 pip equals 10 pipettes.
The value of one pip is different for different currency pairs, but you can calculate it very easily:
Value Of One Pip = (0.0001 / Current Exchange Rate) * Trade Size
If you want to trade the EUR/USD with its current exchange rate of 1.2520 and a contract size of 1 standard Lot ($100.000), you can calculate the pip value as follows: Value of one pip = (0.0001 / 1.2520) * $100.000 = 7.99 EUR
If you multiply it by the current EUR/USD exchange rate, you receive the USD value: 7.99 EUR * 1.2520 = $10 Tip: Whenever the USD is the second (quote) currency, the pip value is $10.
Lot Units Pip value*
Standard Lot100.000$10
Mini Lot10.000$1
Micro Lot1.000$0.1 *if your base currency is USD.
Leverage
Especially in forex, leverage plays an important role. The contract size in forex are Lots and 1 Lot equals 100.000 units, but since most forex traders dont have a trading account that would allow them to buy or sell $100.000 when entering a trade, leverage is a traders best friend or enemy in most cases.
Leverage in a nutshell means that your broker lends you money so that you can enter a position that is actually too big for your trading account. But without leverage, most traders wouldnt even bother trading because their profit opportunities would be close to zero.
If you want to take a trade with the size of one standard Lot, youd have to buy $100.000 to enter the position. But if you chose a leverage of 100:1, you can enter a one standard Lot position with an account of only $1.000:
Required Account Size = Trade Size In $ / Leverage
$100.000 / 100 = $1.000
Leverage and the risk of wiping out a trading account go hand in hand, and after Oandaanalyzed the performance of their customers trading accounts, they found the following relationship: traders who use a leverage of 50:1 have a 15 times higher chance of blowing up their accounts than traders who only use a leverage of 10:1. http://www.tradeciety.com/wp-content...margincakk.png
Margin
Margin is very similar compared to leverage and its mainly just another way of looking at the same thing. If your broker requires you to have a 2% margin, it just means they are offering you a 50:1 leverage ratio.
Leverage = 1 / Margin
50:1 = 1/2% = 1/0.02
This means that your trading account has to be at least 2% of the value of the trade you are about to take. Margin, therefore, works as a deposit that the trader hat to provide to the broker when entering a trade.
With $1.000 margin (a trading account of $1.000), you can trade up to $100.000 with a 100:1 leverage (1% margin requirement).
When a losing trade falls below the maintenance margin, you receive a margin call and your positions are being liquidated by your broker or you are required to deposit additional funds to remain in the trade.
Position sizing is straight forward with 4 easy steps and you only need the following figures to determine the size of your position correctly:
Your account size [$50.000]
The % you want to risk per trade [1.8%]
The stock price [$45]
Stop Loss Price [$40]
Step 1 Your $-Amount Of Risk
Risk = [(Your Account Size) * (%-Risk Per Trade)] $50.000 * 1.8% = $900
You are willing to risk $900 on this single trade
Step 2 Stop Loss
Stop Loss In % = 1 (Stop Price/Current Price)
1 (40/45) = 11%
Step 3 Position Size
Position Size = Your $-Risk / %-Stop Loss
$900 / 11% = $8.180
Step 4 Number Of Shares To Buy
Number Of Shares = Position Size / Current Stock Price
$8.180 / $45 = 180
You have to buy 180 shares for the current price of $45 to enter the trade with the correct position size.
Chris Perruna offers an excel spreadsheet that lets you do the calculations yourself and if you are a forex trader, you can use Babypips position size calculator. The above 4-step calculation just serves as an explanation so that you know what you are doing rather than blindly hammering in some numbers.
Expectancy Of Your System
The expectancy of your trading system is the USD-value that each individual trade you take is worth and will yield you over the long term. You need the following figures to calculate the expectancy of your system and its the first and easiest way to see whether your system is profitable or not.
Expectancy = Winrate*(Account Size * %-Risk * Risk:Reward) Loss Rate*(Account Size * %-Risk)
Expectancy = 60% * ($50.000 * 1% *2) 40% *($50.000 * 1%) = $400
In general, the expectancy formula consists of 2 parts: the expected return of a winning trade and the average loss of a losing trade:
Expected Profit Of A Winning Trade = Winrate * (Account Size * %-Risk * Risk:Reward)
60% * ($50.000 * 1% * 2) = $600
Expected Loss Of A Losing Trade = Loss Rate* (Account Size * %-Risk)
40% * ($50.000 * 1%) = $400
Likelihood Of Losing And Winning Streaks
Traders underestimate the likelihood of losing and winning streaks, and in general lack the knowledge how to calculate probabilities for losing and winning streaks. In the following well show you how you can calculate the likelihood of streaks with a few simple formulas. You only need the statistics of your winrate [60%] and loss rate [40%].
Likelihood Of Winning Streaks
2 Winners In A Row = Winrate * Winrate
60% * 60% = 0.6 * 0.6 = 0.36 = 36%
3 Winners In A Row = Winrate * Winrate * Winrate
60% * 60% * 60% = 21.6%
4 Winners In A Row = Winrate * Winrate * Winrate * Winrate
60% * 60% * 60% * 60% = 13%
If you would like to calculate the probabilities of having a certain losing or winning streak within a number of trades, you can use the streak calculator from sportsbookreview. The chart below shows you the probabilities of winning (or losing) streaks with certain lengths for different winrates. http://www.tradeciety.com/wp-content...ds/streaks.png
Account Loss And Recovery Rate
Now that we know how to calculate the likelihood of winning and losing streaks and saw that it is far more likely to have 10 consecutive losing trades in a row than you thought, we can evaluate the effect of losing streaks on your account.
If you calculate your position size new after every trade, which is highly recommended, risking 2% per trade, 2 consecutive losing trades will not amount to 4%, but only to a loss of 3.96% with each losing trade, the 2% risk per trade becomes a smaller $-amount.
Account Size
$-Value Of 2% Risk
%-Loss Of The Starting Account
$ 10.000$ 200
$ 9.800$ 1962.00%
$ 9.604$ 1923.96%
$ 9.412$ 1885.88%
$ 9.224$ 1847.76%
$ 9.039$ 1819.60%
$ 8.858$ 17711.41%
The %-amount of consecutive losing and winning trades can be calculated as follows:
The %-Loss Of 2 Consecutive Losing Trades, Risking 2%:
1-[(1-0.02)*(1-0.02)] = 0.0396 = 3.96%
The %-Loss Of 3 Consecutive Losing Trades, Risking 2%:
1-[(1-0.02)*(1-0.02)*(1-0.02) ]= 5.88%
How big losses can get if you risk 1%, 2%, 4%, 5% or 7% per single trade you can see in the following table.
The problem with big losses is not only that they cost you a lot of money, but the time needed to recover from such losses. If you have a $10.000 account and lose 50% ($5.000) of your account, you need to regain 100% ($5.000) to get back to your original $10.000 most traders dont make this connection and therefore significantly underestimate the meaning of losses. The following graph shows you the relationship in more detail. If you lose 70% of your trading account, you need to regain 233% to get back to where you started.
If you connect the three things weve discovered so far:
it is very likely (and it will happen to every trader) to have 6, 7 or even 10 consecutive losing trades
if you risk a high %-amount per single trade, your losses can be significant
significant losses take a long time to recover from
it becomes clear why a sound risk and money management approach should be the #1 priority for every trader.
Profitability Check
Did you know that you that your stop loss distance and your take profit distance, together with your past winrate can tell you if you should take a trade or if the specific trade would be unprofitable over the long term? Here is how you can combine winrate [60%], stop loss distance [40 pips] and take profit distance [65 pips] to check your trade for profitability:
Risk:Reward Ratio = Take Profit Distance / Stop Loss Distance
65 / 40 = 1.625
Required Winrate = 1/ (1+ Risk:Reward Ratio)
1 /(1+ 1.625) = 0.38 = 38%
The required winrate is smaller than the historical winrate (38% < 60%) which means that you can safely take the trade
Correlation is a statistical figure that shows you to which degree two financial instruments move together. The correlation is a number between -1 and +1; sometimes correlation is being displayed as percentage figures between -100% and +100% to allow a faster interpretation of the metric. http://www.tradeciety.com/wp-content/uploads/corr-1.pngCorrelation -1:
If Stock A rises 1%, stock B falls 1%.
A correlation of -1 means that the two instruments are perfectly negatively correlated. If one asset rises, the other one falls at the same rate. The graph shows two instruments with a correlation of -1 one graph is the mirror image of the other one.
Correlation -0.5: If Stock A rises 1%, Stock B falls 0.5%. Correlation 0: No correlation between two instruments exists and they move completely independently from each other. Correlation +0.5: If Stock A rises 0.5%, Stock B rises +0.5%. http://www.tradeciety.com/wp-content/uploads/CORR1.png
Correlation +1: If Stock A rises 1%, Stock B rises 1%.
A correlation of +1 means that two instruments move together identically with the same strength and also in the same direction.
The chart shows two stock prices with a correlation of +1 (+100%). Both instruments rise and fall together with the same strength. Although a correlation of +1 is very rare, you will often have correlations that are close to +1, signaling two very similar instruments.
What Do Correlations Mean For Your Trading?
Correlations can increase or decrease your risk when entering trades. If you buy or sell two stocks that are positively correlated, you increase your risk because both stocks rise and fall together.
A negative correlation can decrease your risk since both stocks (and instruments) will move in opposite ways. When one stock rises, the other one will fall and therefore serve as some kind of hedge.
If you trade stocks, you can use the correlation calculator form buyupside to calculate correlations between different stocks and if you are a forex trader, the correlation calculator from mafa is all you need. http://www.tradeciety.com/wp-content...corrttrad2.png Word Of Caution
Correlations change over time and can even change from a positive to a negative correlation. The chart below shows the price development of the S&P500 and Oil. As you can see, both instruments have been correlated positively, but changed to a highly negative correlation in recent times and also had times when no correlation existed.
Growth Of Capital
The magic why your trading account can grow fast is because of exponential growth.When you have a regular 9-5 job you get a constant salary and the income in one month is usually independent from the one you got the month before. In trading, your capital can work for you and if you have a winning trade, you can risk a higher $-amount on your next trade and therefore also make a greater profit. The graph below compares linear growth (blue) where you just save the same amount every single time, exponential growth (red) where you reinvest your profits and the red graph that simulates the trading performance (risk:reward 2:1 and winrate 50%). While the linear graph has only risen to $50.000, the exponential graph grew to $280.000 and the trading graph to $200.000. All three graphs are based on an initial investment of $10.000 and a 2% growth rate. http://www.tradeciety.com/wp-content/uploads/growth.png
Why Traders Screw Up: Randomness, Independency And Sample-Size-Thinking
Randomness, Independence and Sample-Size-Thinking are three of the main statistical concepts that traders get totally wrong and are the main reasons why they completely misinterpret their trading performance.
Randomness
Randomness means that the distribution between winning and losing trades is completely random over the short-term.
Independence
The concept of independency means that one trade is completely independent from the one before. If your last trade was a winner, it does not have any impact on the outcome of your next trade.
Sample-Size-Thinking
Both, the concept of randomness and independence are being misunderstood by traders because they dont understand the most important concept: statistically significant sample-sizes. The mistake traders often make is that they judge their trading system based on the outcome of just a handful of trades.
Weve seen above that its more likely to have 2 winners in a row than 3, but statistics only provide meaningful information if you analyze a big enough sample size. Therefore, dont make premature decisions whether your trading system is good or bad after 10 or 20 trades, but take 100 trades with the exact same rules and then analyze your performance.
Conclusion: The Math Guide For Traders Is All You Will Ever Need
Whereas not understanding or being aware of how math and statistics work in trading will significantly deteriorate your overall edge, you dont need to get your Masters degree to trade profitably. In most cases, its even sufficient if a trader would apply some common sense when trading. With the concepts in this math guide for traders you are good to go and it includes all mathematical and statistical principles you will ever need in your trading.
Richard Donchian first compiled these “Twenty Trading Guides” in 1934 to helpstock traders. He unearthed a complete copy of the rules again in 1966, and he found that most of them applied to commodities as well as to stocks & that all 20 of them had maintained their usefulness & validity. The “Twenty Trading Guides” will probably survive & prove valid for the next 75 years as well. They still make sense.
Richard Donchian General Guides:
Beware of acting immediately on widespread public opinion. Even if correct, it will usually delay the move.
From a period of dullness & inactivity, watch for & prepare to follow a Move in the direction in which volume increases.
LIMIT LOSSES, ride profits- irrespective of all other rules.
Light commitments are advisable when a market position is not certain. Clear defined moves are signaled frequently enough to make life interesting, & concentration on these moves to the virtual exclusion of others will prevent unprofitable “whipsawing”.
Seldom take a position in the direction of an immediately preceding three-day move. Wait for a one-day reversal.
Judicious use of stop orders is a valuable aid to profitable trading. Stops may be used to protect profits, to limit losses & to take positions from certain formations such as triangular foci. Stop orders are apt to be more valuable & less Treacherous if used in proper relation to the chart formation.
In a market in which upswings are likely to equal or exceed downswings, a heavier position should be taken for the upswings for percentage reasons.
In taking a position, price orders are allowable. In closing a position, use “market” orders.
Buy strong acting, strong background commodities & sell weak ones, subject To all other rules.
Moves in which rails (now the Transportation Index) lead or particular strongly are usually worth following more than moves in which rails lag.
A study of the capitalization of a company, the degree of activity (a varying factor), and whether an issue is a lethargic truck horse or a spirited, volatile race horse is fully as important as a study of reports.
Richard Donchian Technical Guides
All 9 of these technical guides apply equally well to major & minor formations.
A move followed by a sideways range often precedes another move of almost equal extent in the same direction as the original move. Generally, when the second move from the sideways range has run its course, a counter –move approaching the sideway range may be expected.
Reversal or resistance to a move is likely to be encountered (a) on reaching Levels at which the commodity has fluctuated for a considerable length of time within a narrow range in the past or (b) on approaching previous highs or lows.
Watch for good buying or selling opportunities when trend lines are approached, especially on medium or dull volume. Be sure such a line has not been hugged or hit too frequently.
Watch for “crawling along” or repeated bumping of minor or major trend Lines & prepare to see such trend lines broken.
Breaking of minor trend lines counter to the major trend gives most other important position-taking signals. Position can be taken or reversed on stops at such places. (This is possibly the most important of all the technical guides).
Triangular of either slope may mean either accumulation or distribution, Depending on other considerations, although triangles are usually broken on the flat side.
Watch for volume climax, especially after a long move.
Don’t count on gaps being closed unless you can distinguish between breakaway gaps, normal gaps & exhaustion gaps.
During a move, take or increase positions in the direction of the move at the market the morning following any one-day reversal, however slight the reversal may be, especially if volume declines on the reversal. (This has proved to be very valuable guide).