Now the price has reached the lower part of that gigantic down trend channel. Maybe a short pause here, but if the price breaks the long term channel that pair could break “Guinness” record! But thats my view. will see...
Thanks Yvon for taking the trouble to write this and post on this forum.
I think I understand about using higher time frame to anticipate the market. I need read again, several time, to digest it. After that to post some charts, you can then help me by giving feedback whether I have understood it.
{quote} Thanks Yvon for taking the trouble to write this and post on this forum. I think I understand about using higher time frame to anticipate the market. I need read again, several time, to digest it. After that to post some charts, you can then help me by giving feedback whether I have understood it. Thank you so much
eurusd: depending of the platform used I can see a difference to where the channel is drawn. Well this is what happening for me at least. So on oanda platform the price on the monthly chart has reached the channel while on the AVA platform there is still about 550 pips to go before reaching the border! so on the last one the standing price and the parity is about 550 pips . So I am incline to say that I am not that good at drawing and there is still 550 pips or so to the border.
Yvon, Replying to your post 28800 (anticipating) - I spotted GBPUSD (12 March) after reading your post and did this trade. {image}{image} Do leave me your comments.
Ignored
hi Nic,
sorry Nic, I don't read your chart at this point. I don't see your entry nor your exit .Would you explain in other wordings, please do not use abreviation,
thank you
Sorry about the confusion. Here is my explanation. Hope you understand my language as I am not proficient in English.
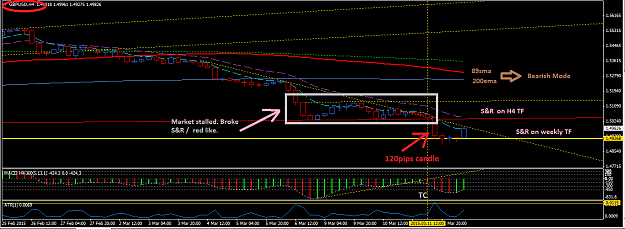
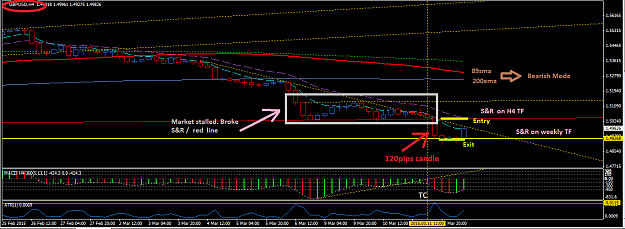
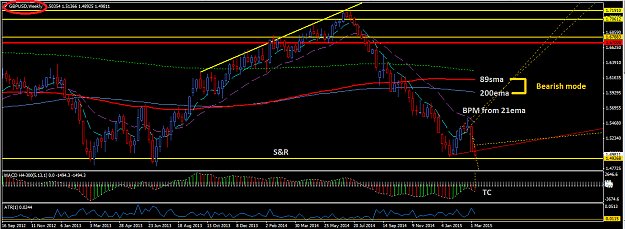
Anticipating From higher time frame 1. Check on the higher time frame. In this case, found on the Weakly time frame that there a BPM from 21ema (market) and TC on MACD. 2. Next target level was a low of 1.49268. 3. Above indicate there was a possibility of price moving further downwards. 4. On H4 time frame, market is at the recent low / S&R (red line). The candle closed price opened below the S&R and a TC (MACD) was formed. 5. Took a entry here, stop loss at the recent low of weekly time frame. 6. This was somewhat a late entry, but waited for a pull back / stall and confirmation before taking the trade. 7. Results: Target was hit, 120 pips gained.
Hi Yvon, Re: Post 28806. Sorry about the confusion. Here is my explanation. Hope you understand my language as I am not proficient in English. Anticipating From higher time frame 1. Check on the higher time frame. In this case, found on the Weakly time frame that there a BPM from 21ema (market) and TC on MACD. 2. Next target level was a low of 1.49268. 3. Above indicate there was a possibility of price moving further downwards. 4. On H4 time frame, market is at the recent low / S&R (red line). The candle closed price opened below the S&R and a TC...
Ignored
Hi Nic,
Exactly, congrats!
You have it right. I see it better now, thanks for explaining to me.
As you see now, when it is clear on higher time frame of the direction, it gets easier to open position in the right direction on the 4hrs TF. Higher Time frame is a zoom out of lower time frame. Even on daily TF, in the gbpusd a 3 sisters can be seen( just before the break of 21ema), then a break out of the 21ema, where you took your trade.
Very well done Nic.
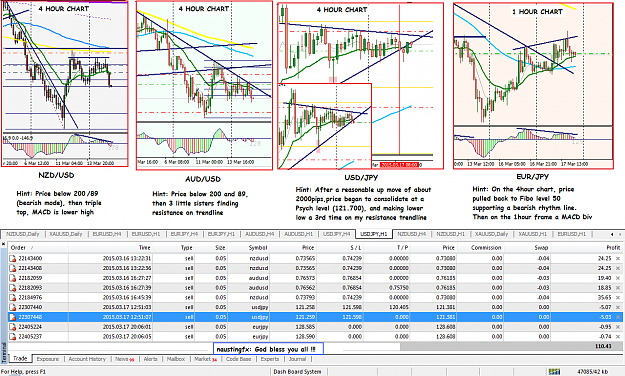
I am trading 6 currencies recently. I have summarized Phillip's Strategy the way it suits my life style because of recent developments for me. If you look at the bottom of my platform (see picture below) you will see the name I have called it (Dash Board System). I have the 6 currency pairs displayed at the same time time on my screen, and when I am there to watch the market life, I look at few things according to the rules of the system, and when things are set, I just board the flight with my destinations well defined... some times, I employ an auto pilot to monitor my journey with a tested and reliable trailing number.
I am trading 6 currencies recently. I have summarized Phillip's Strategy the way it suits my life style because of recent developments for me. If you look at the bottom of my platform (see picture below) you will see the name I have called it (Dash Board System). I have the 6 currency pairs displayed at the same time time on my screen, and when I am there to watch the market life, I look at few things according to the rules of the system, and when things are set, I just board the flight with my destinations well defined... some times, I employ an...
Ignored
Hi naustingfx,
It is a nice template you’ve got there. And rooms at the bottom to write notes! That’s cool! How did you managed to set it like that? That’s very nice!
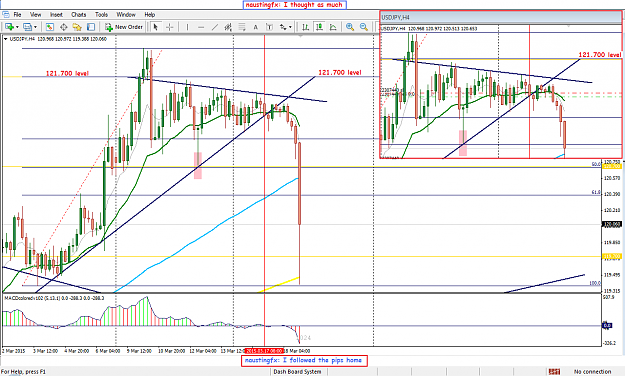
I have given a very good hint as to why I took the trade as seen in the chart below. Just 2 post up (post 28810), you will see the template I had posted for the multiple pairs I got involved with, among which is the Usd/Jpy.
I hope someone will find good use of it.
God bless.
{quote} Hi naustingfx, It is a nice template youve got there. And rooms at the bottom to write notes! Thats cool! How did you managed to set it like that? Thats very nice!
Ignored
Great folk!
I enjoyed reading you. Thanks!
I was thinking if I could make just a video to show how I did it???? I dont have my head phones with me here ...I traveled...
But I used the normal windows paint.
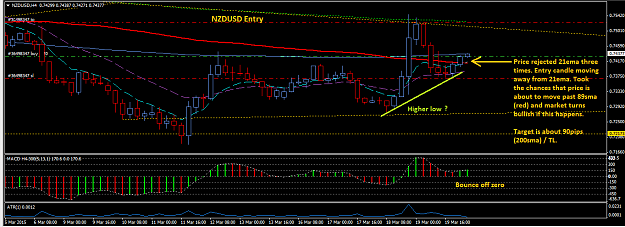
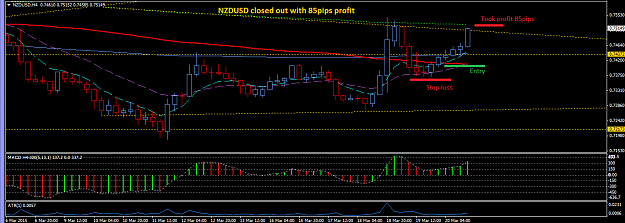
I have here NZDUSD that I took on 20 March 2015. Please anyone and everyone is welcome to comment. Explanation is within chart hope it's helpful. Thanks.
Hi Yvon, Thanks for replying to post 28,809. I have here NZDUSD that I took on 20 March 2015. Please anyone and everyone is welcome to comment. Explanation is within chart hope it's helpful. Thanks. {image} {image}
Ignored
hi Nic,
It's by the rules!
A very well done trade! Keep doing the good work!
love it!
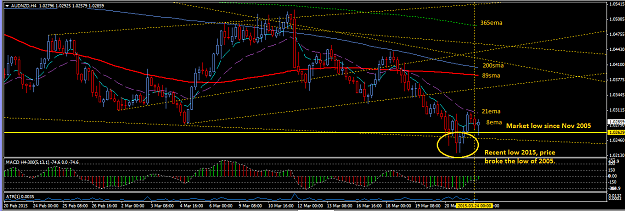
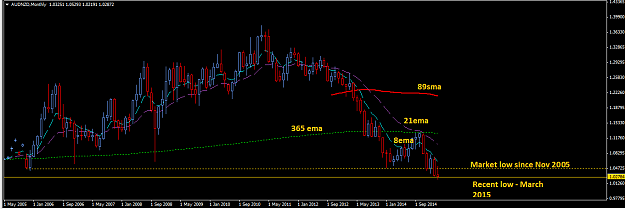
Thank you Yvon for your reply (post 28815) I have here 2 charts on AUDNZD i.e. H4 and Monthly. Recently, the market has broken the 2005 low. What could happen next, if someone here could enlighten me? Observe from the charts, there the mood is bearish: 1. 89sma is above the market. 2. 200sma on H4 is above market and pointing down. The last candle on the H4 chart is rejecting the 2005 low but that candle is not complete yet. Should we wait for price to break the 2005 low, pull back and move away in order to confirm it's continual down trend? Anyone...
Ignored
Hi Nic,
not a lot of people around!
there is my view on it:
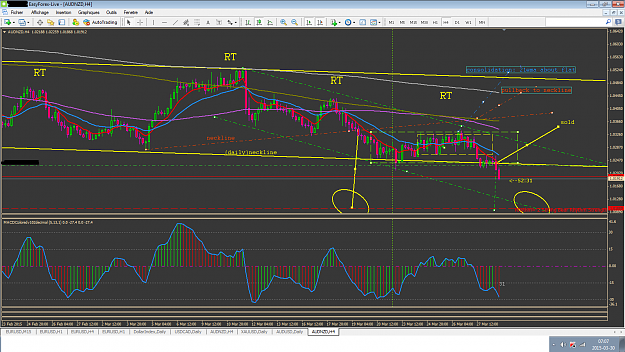
I didnt get involved in the AUDNZD.( no new trade) But Ill get my view on it as if up to the march 23.
I am using the 4hrs chart and the daily.
On the daily I looked first for the rhythm, the bounces as well as possible bounces in the next future. Just to see if any figure would just come apparent to me up to march 23.
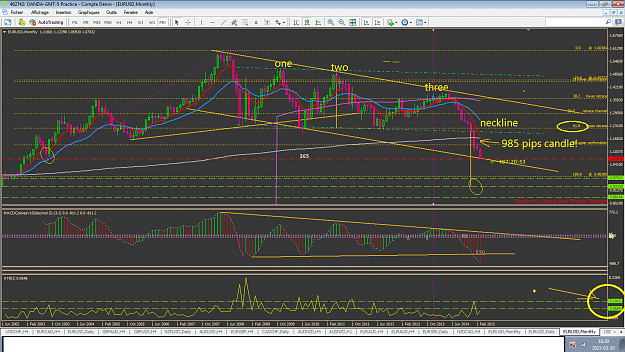
One figure is visible : sure! It is a big head and shoulders formation on the daily chart. So the projection could end up some 800+pips lower, but needs to break the neckline first. Dont forget that HS are RT. And RTs have rules that goes with them.
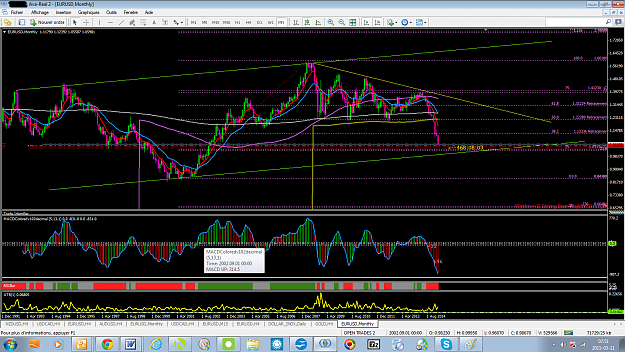
now on the 4hrs chart: there is also a HS or RTs. the last RT stopped at the daily neckline with a kind of consolidation. Some space started widening between the 8ema and the 21ema. Candles have there bodies pushed lower. will it break? (150330)IT DID BROKE! And I changed my mind about it, I sold it!
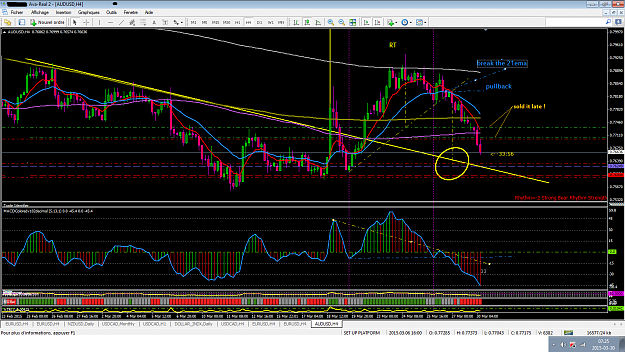
Audusd:
It shows also a HS or RTs, the RT(head)expected a fall in price which happened, hanging now around the 89sma (about 100+ lower). But the HS shows also a possible down move expected to be at .7620 aprox.-if it breaks the 89sma. So it could be still some move down possible at about 80 pips lower, but will see
02:52 hrs: there is now a tentative break of the 89sma...
---decided to get involved in a trade there.,quite late but still some room for profit. already at free ride down now
While both shoulders are at about the same level on the monthly chart, the macd shows a weak momentum on the right shoulder, quite weak. The target could be as low as 0.6025.
Target has been reached. Averaging some 70 pips +gain
I will stand around for some possible more moves down...
{quote} Hi Nic, not a lot of people around! there is my view on it: I didnt get involved in the AUDNZD.( no new trade) But Ill get my view on it as if up to the march 23. I am using the 4hrs chart and the daily. On the daily I looked first for the rhythm, the bounces as well as possible bounces in the next future. Just to see if any figure would just come apparent to me up to march 23. One figure is visible : sure! It is a big head and shoulders formation on the daily chart. So the projection could end up some 800+pips lower, but needs to break...
Ignored
Just closed trade for the long weekend: 47 pips gain