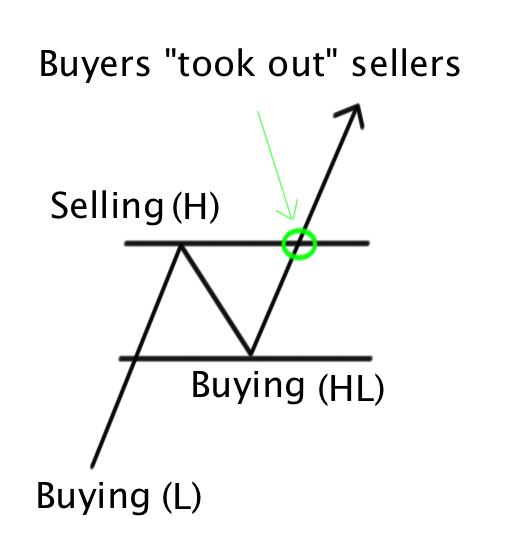
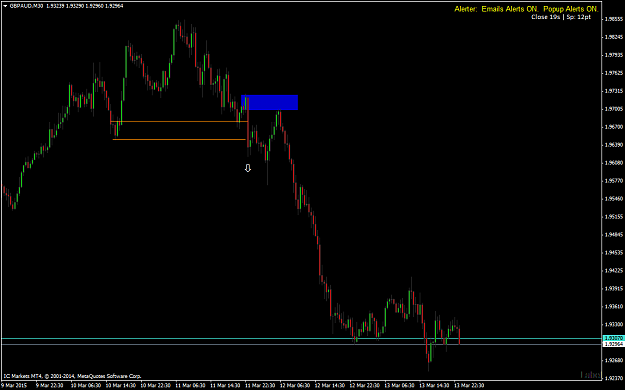
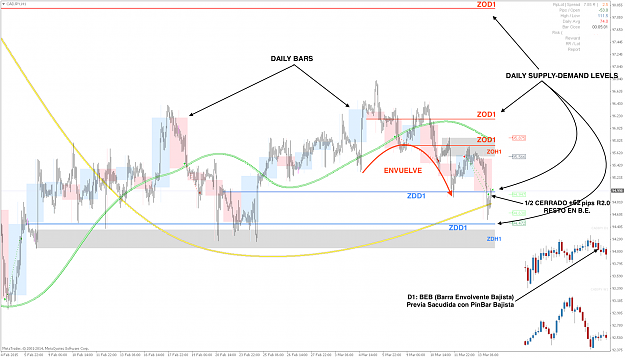
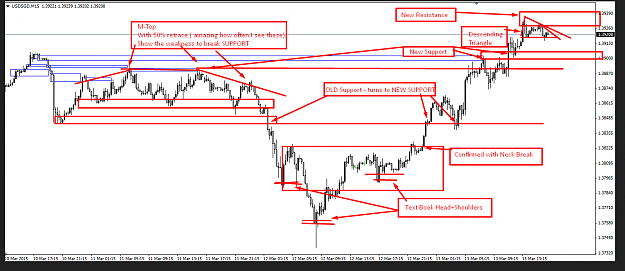
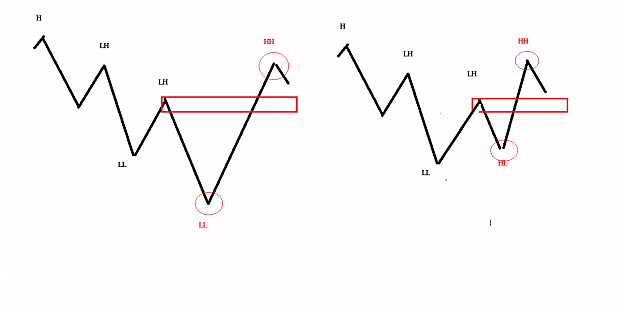
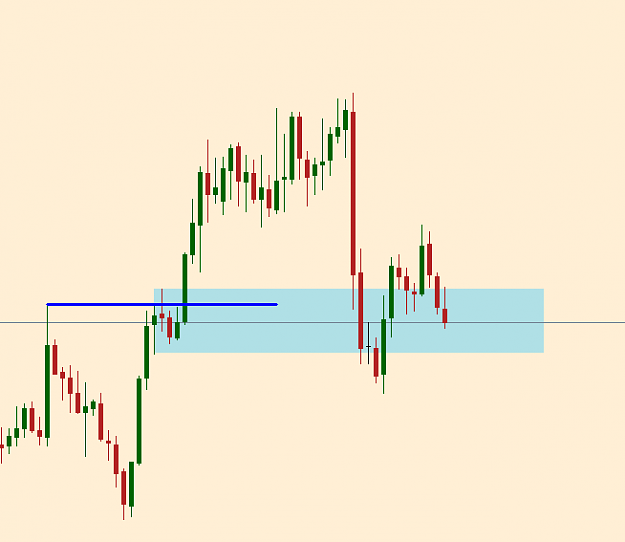
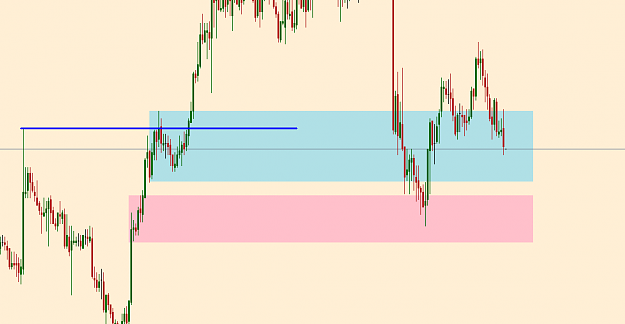
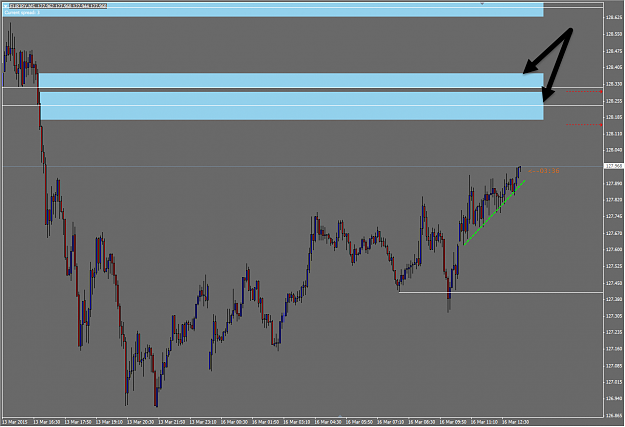
I have lately been frustrated when trying to understand the relationships between supply and demand including the hierarchy among them. Certain SD that is engulf means more than certain SD that is engulfed.... I thought I hit the brick wall and then somehow I found the relationship. I can't believe how much precision there is in the market. There is a lot of order in it. Here are 2 charts showing the relationship of SD
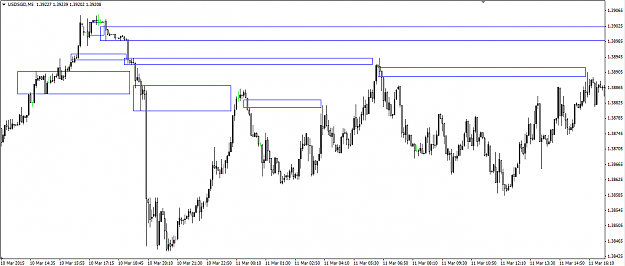
There are still some things I am unsure of. But this is one piece I uncover for myself.
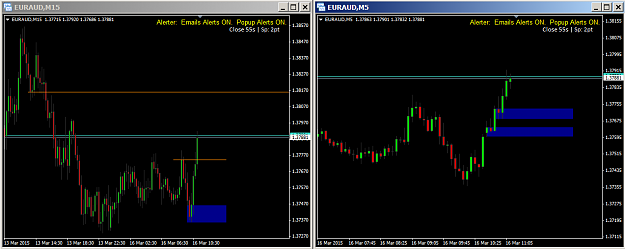
Attached Image (click to enlarge)
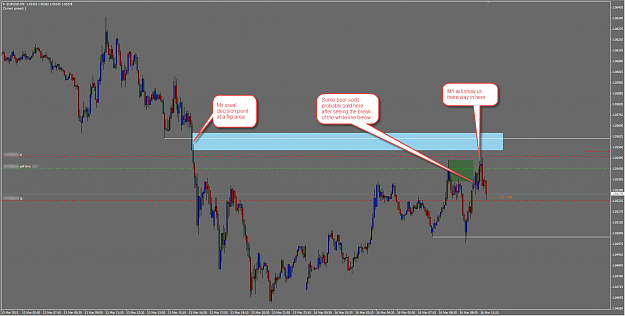
Attached Image (click to enlarge)
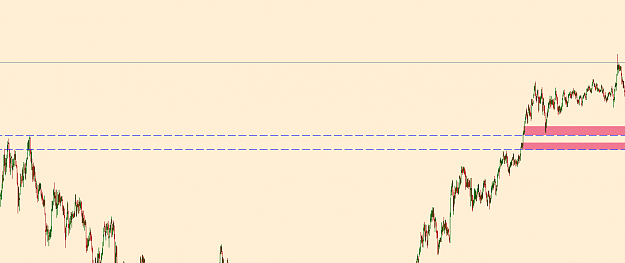
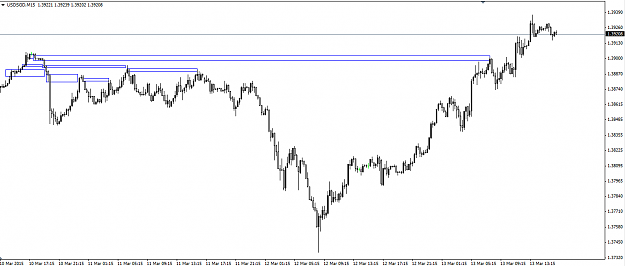
There are still some things I am unsure of. But this is one piece I uncover for myself.
Riding the order flow