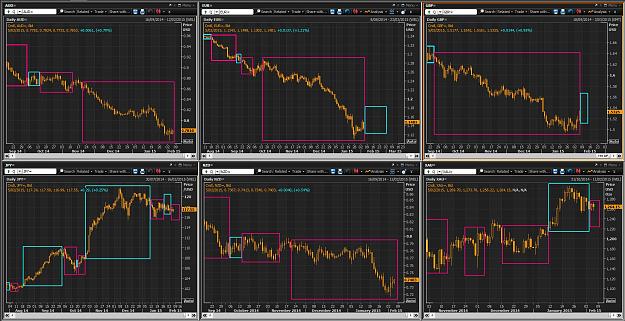
This is what I like about looking at the internals or intra day and building a daily indicator around it. Whilst the Aussie and Euro are basically tracking sideways ( on a daily TF) it still shows on the Capflow that net buying is happening every day hence swinging my indicator around from red to blue. It's still not there yet on the 12 day average, the six day is very much blue (take buy triggers) though. I have to wait for the 12 day one to turn, as evidenced by my losing pre-emptive trade in the Kiwi and Aussie above.
It's like the inta-day activity of Aussie and Euro is saying, "yes I may appear directionless, but actually my activity is very subtly buying and soon this buying pressure will manifest in higher prices" Wishful thinking maybe... we'll see.
It's like the inta-day activity of Aussie and Euro is saying, "yes I may appear directionless, but actually my activity is very subtly buying and soon this buying pressure will manifest in higher prices" Wishful thinking maybe... we'll see.
Attached Image (click to enlarge)