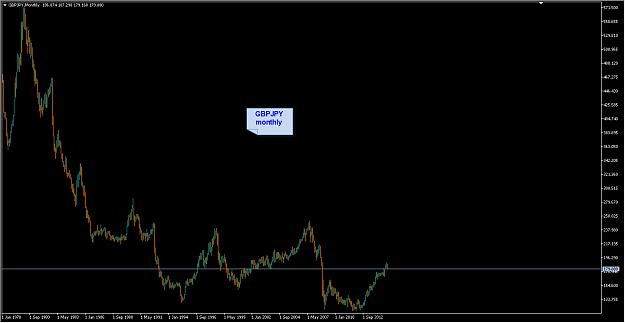
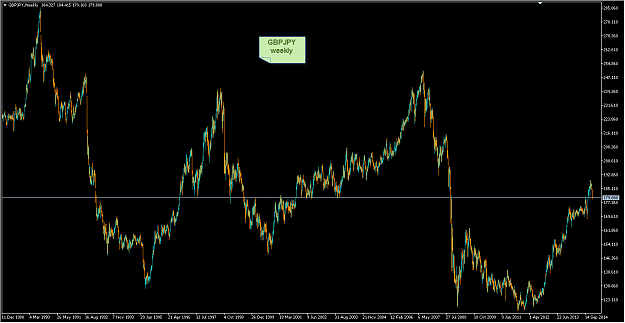
GBPJPY
EW analysis
long term
can anyone show me a chart with price history as long back as possible? I have only data back to 1993
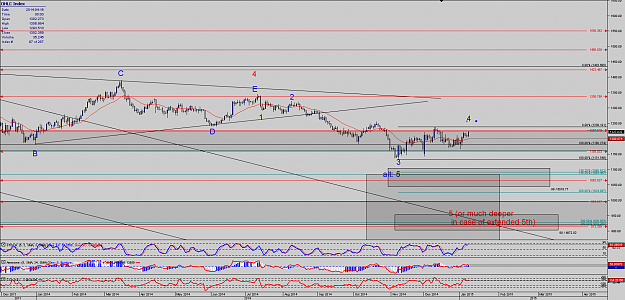
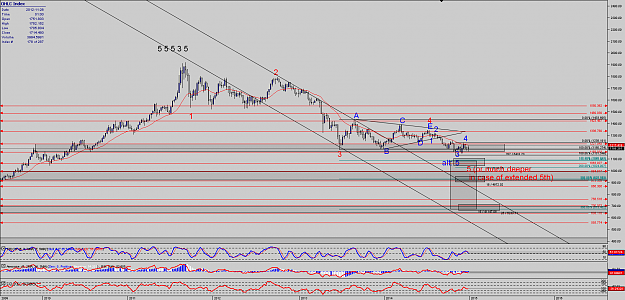
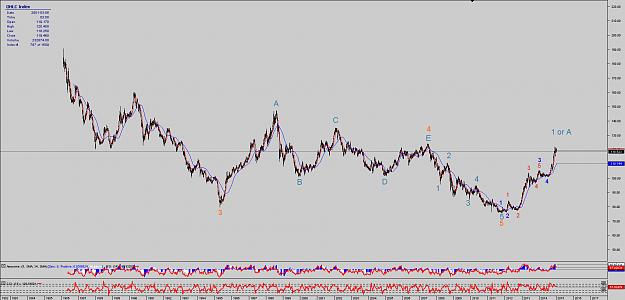
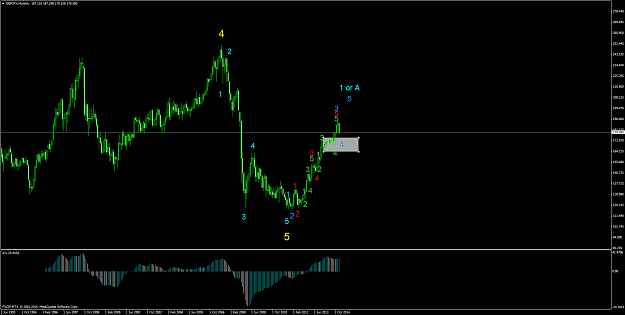
I found one old chart from Prechter, where he had labeled the 251 peak in 2007 as end of a wave 4.
Normally his long term charts are extremely good researched, so I trust him here.
According to that, the low @ 116.882 is the end of a wave 5.
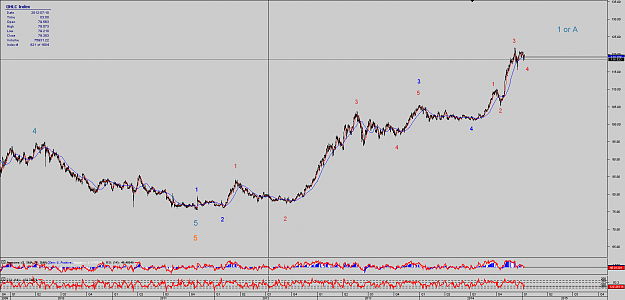
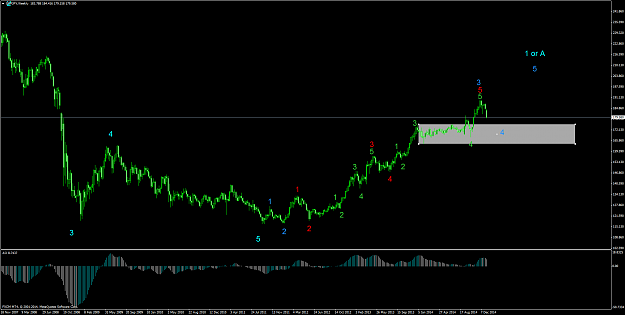
The recent move up, when finished, can be labeled as wave 1 or A
Now it seems, that we have finished wave 3 (blue 3) of this wave 1 or A.
The following wave 4 should find support in the 175.5 to 164 area
Have never traded this pair. But I am astonished, how clear the waves are.
EW analysis
long term
can anyone show me a chart with price history as long back as possible? I have only data back to 1993
I found one old chart from Prechter, where he had labeled the 251 peak in 2007 as end of a wave 4.
Normally his long term charts are extremely good researched, so I trust him here.
According to that, the low @ 116.882 is the end of a wave 5.
The recent move up, when finished, can be labeled as wave 1 or A
Now it seems, that we have finished wave 3 (blue 3) of this wave 1 or A.
The following wave 4 should find support in the 175.5 to 164 area
Have never traded this pair. But I am astonished, how clear the waves are.
Attached Image (click to enlarge)
Attached Image (click to enlarge)