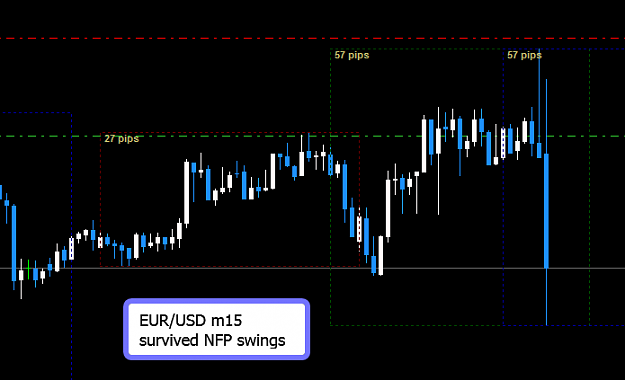
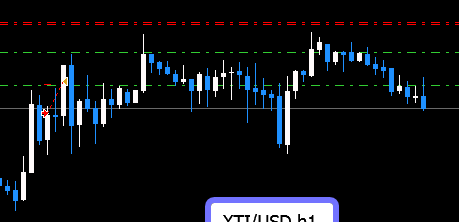
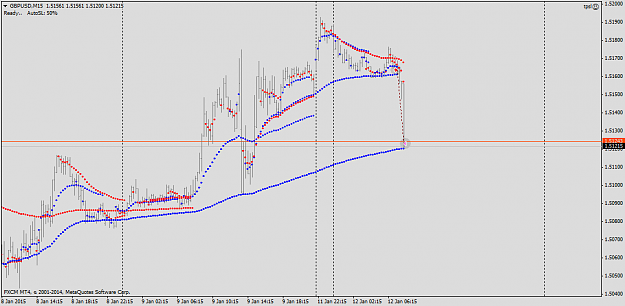
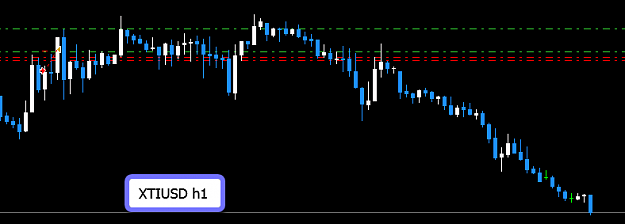
Decided to move stop in prepare for NFP. Close call but I survived. {image} XTI/USD on the other hand didn't swing much if at all. Such clear evidence of manipulation. {image}
Ignored
hehe, you're e/u is nice good stoploss place
got pips from u/j long, as posted earlier. I'm done for this week... good weekend @ all
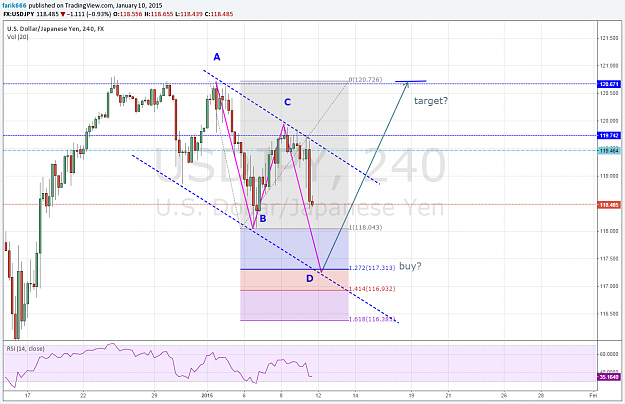
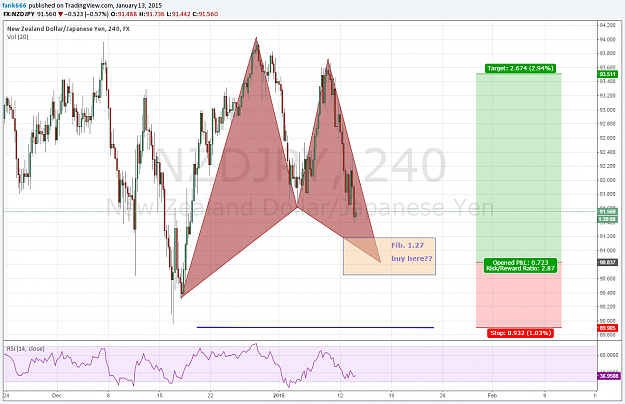
I also have something on USDJPY,, i use questionmarks, because I'm still new to this thing... so its's just a thought. When the price hits the 1.27 levels, it should become quite oversold, and then we should bounce... {image}
Ignored
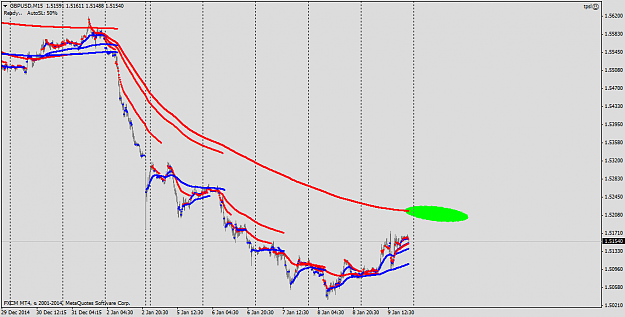
Looking cable, it seems we have a possible good quality setup in the coming days (sell at around 1.5210-1.5212 area, if and when price reach such levels and top right there!), i will be keeping an eye on this.
{quote} Looking cable, it seems we have a possible good quality setup in the coming days (sell at around 1.5210-1.5212 area, if and when price reach such levels and top right there!), i will be keeping an eye on this. {image}
Ignored
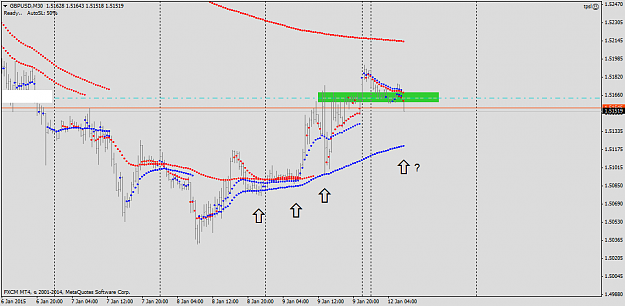
Cable again, i must admit i didn't waited price to reach the resistance-line level as per previous-post decision, however we did get somehow near with today asian market action (a sort of exhaustion up spike at early open).
From there, a slow softening back around friday highs, we are basically in the middle of the range right now, with the down-redline looming, and the support line supposedly waiting to be tested.
{quote} Cable again, i must admit i didn't waited price to reach the resistance-line level as per previous-post decision, however we did get somehow near with today asian market action (a sort of exhaustion up spike at early open). From there, a slow softening back around friday highs, we are basically in the middle of the range right now, with the down-redline looming, and the support line supposedly waiting to be tested. Will it bounce? Will it break? I'm sure that time will answer such questions. {image}
Ignored
(i'm out here at the support line, it was a fast profit, why not take it)
It seems to me that many people are not understanding what is going on.Any which way the biggest players in the market are Banks.So, if you can figure what the Bank game is then doing what they do seems sense to me.
There are signs in every chart, Consolidation,Manipulation ,Bank Stop Runs. Couple these with Support Resistance Supply Demand .
Now take the Fibonacci (which I see as a tool not an indicator,) from the nearest obvious high/ low or low/ high. Wait for price to close above below the 38% line.
Enter with the target to be either Fibonacci 164/176 or 264/276 etc or previous Supply Demand and or previous Resistance Support.Place your stop above below the previous obvious High/Low as appropriate by a min of five pips.Be careful about your money management which is vital for success whatever else you do.
None of this is easy and it takes a hell of a lot of study to even get close to doing this.However, with patience, discipline, and a clear focused mind it will produce results over time.The only indicator I use (as an odds enhancer) is the 8ema which works very well confirming with the Fibonacci 38%.Occasionally I use the Stochastic set at 12,3,3 for another odds enhancer to confirm the price is oversold/overbought However like all indicators they lag and can be confusing. Never trade off an indicator signal alone, trade off price action once the banks have shown the clues as to which way their business needs to go to make profits.Banks control over 58% of the market so, as the biggest players, learn to trade like the Banks.
And they Buy at Demand(low) and Sell at Supply(high) Learn what signals are there in the charts keep it simple. Happy Trading.
It seems to me that many people are not understanding what is going on.Any which way the biggest players in the market are Banks.So, if you can figure what the Bank game is then doing what they do seems sense to me. There are signs in every chart, Consolidation,Manipulation ,Bank Stop Runs. Couple these with Support Resistance Supply Demand . Now take the Fibonacci (which I see as a tool not an indicator,) from the nearest obvious high/ low or low/ high. Wait for price to close above below the 38% line. Enter with the target to be either Fibonacci...
Ignored
Thanks for your post, interesting read!
It's true that nobody (and i'm not talking about the retail traders, institutional traders and banks as well) don't understand what's going on in the market, not all the time at least.
The few times a trader have an understanding or at least an idea of what's may be going on, that's the time a good trade can be executed.
Tthis doesn't apply to the retail traders, whom want to be on a trade all the time just for the sake of be in a trade (gambling psychology).
I don't think it do exist a specific technical approach that can be considered the right one or the best one, each and every technical system/indicator show overall the same thing, you use your fibonacci for example, i use my indicators, some guys use macd and some use nothing at all, technical systems are here to help us understand what may be going on, and when we have an idea about it, we may see an opportunity and make a trade.. that's all.
I have modified my trading strategy slightly in the past month,from a very "simple" naked chart buy-low sell-high one to a not-naked somehow more dynamic trend-based and still buy-low sell-high one, so i feel not entitled anymore to post in this thread that instead is dedicated to the simple naked-chart buylow sellhigh style.
Anyway.. who really cares right, i don't really do.
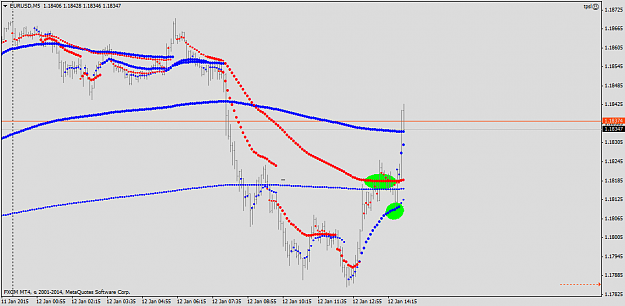
Here is an eurusd chart, today seems like a bearish day (at least for now), i grabbed a sell on the 1min chart.
If the market break in the next few hours, we can as well aim at previous week lows, as long as price stay below the resistance redline i consider it bearishly correct.
{quote} Thanks for your post, interesting read! It's true that nobody (and i'm not talking about the retail traders, institutional traders and banks as well) don't understand what's going on in the market, not all the time at least. The few times a trader have an understanding or at least an idea of what's may be going on, that's the time a good trade can be executed. Tthis doesn't apply to the retail traders, whom want to be on a trade all the time just for the sake of be in a trade (gambling psychology). I don't think it do exist a specific technical...
Hi tunara
Many thanks for your kind reply. I agree with what you are saying and congratulate you on all your work.I am wondering why you only close out for 20 pips on
€/$ Had you entered at 0805 this morning there was a very good entry based on my idea ,good for 45 pips going to Fib 276 I do not know how to download a screen shot from my mac to the forex factory thread Maybe you could help me here. That would make it so much easier to share my little idea with you A picture is worth a thousand words is so true for traders
Best wishes and Happy Trading
Hi tunara Many thanks for your kind reply. I agree with what you are saying and congratulate you on all your work.I am wondering why you only close out for 20 pips on €/$ Had you entered at 0805 this morning there was a very good entry based on my idea ,good for 45 pips going to Fib 276 I do not know how to download a screen shot from my mac to the forex factory thread Maybe you could help me here. That would make it so much easier to share my little idea with you A picture is worth a thousand words is so true for traders Best wishes and Happy Trading...
Ignored
Sure, i never used a mac so i don't know exactly where and what to click in order to make a screenshot, but i guess you can use some external service (like this http://app.prntscr.com/en/download.html for example).
Hope it help.
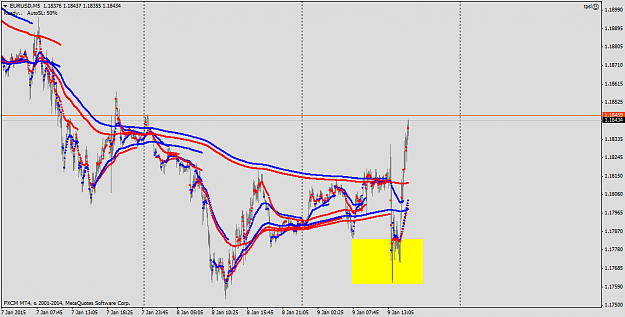
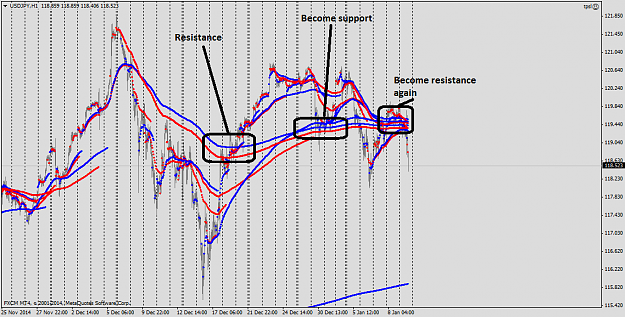
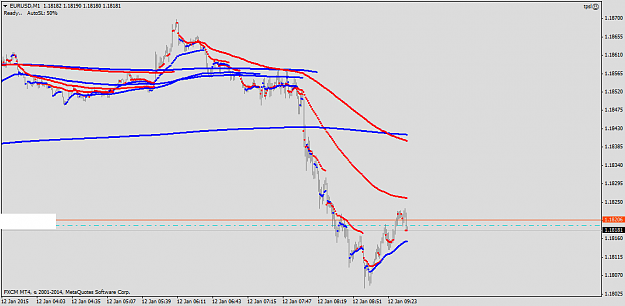
About eurusd, i don't know what you mean (yeah hard to understand each other without images), however i've decided to give it another shot, as we can see we are now testing a ex-support line (supposedly now become resistance) and a resistance line too, so.. it can be something.
{quote} Sure, i never used a mac so i don't know exactly where and what to click in order to make a screenshot, but i guess you can use some external service (like this http://app.prntscr.com/en/download.html for example). Hope it help. About eurusd, i don't know what you mean (yeah hard to understand each other without images), however i've decided to give it another shot, as we can see we are now testing a ex-support line (supposedly now become resistance) and a resistance line too, so.. it can be something. Take care {image}
Hey guys. Sorry for lack of updates, been playing some games
Unfortunately out of EUR/USD at a small loss. Should have taken profit after NFP. Too naive I was, too naive.
However XTI/USD is doind super! I set my TP around 40-41 zone. Hope it gets there without stopping me out at BE. *fingers crossed*
If TP hit- top trade 1:20R, second trade 1:8R
Attached Image (click to enlarge)
Everything you can imagine, is real - Pablo Picasso
I dont know how to show completed trades on chart, but I'm running hot this 2 days... made over 340 pips in different trades.
Not all "buylow/sellhigh" bust sort of... im applying different strategies and patterns... and what I'm trying to do is to combine, or to look places where these patterns come together with our "buylow/sellhigh" system...
Like ABCD ending on previous top/bottom.... let's just wait and see where this is taking me.... maybe I'm just lucky with my last 12 trades (10w:2loss).
Also I started to look on trades with risk/reward perspective and I started using trailing stops...
As of this I am going to make this trade:
I'm still not sure what if i'm doing anything right here, but lets see
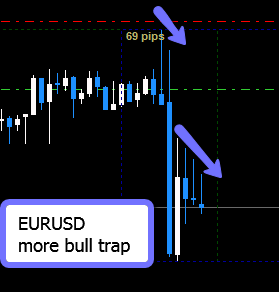
{quote} Surprise! I guess i'm out for the day {image}
Ignored
Hi tundra,Thanks for your reply I will try your suggestion and in the end will solve the problem Then i can share a screen shot with you and all will be clear. I am pretty tied up til friday with other stuff so will pay attention to the challenge then meantime happy trading
It seems to me that many people are not understanding what is going on.Any which way the biggest players in the market are Banks.So, if you can figure what the Bank game is then doing what they do seems sense to me. There are signs in every chart, Consolidation,Manipulation ,Bank Stop Runs. Couple these with Support Resistance Supply Demand . Now take the Fibonacci (which I see as a tool not an indicator,) from the nearest obvious high/ low or low/ high. Wait for price to close above below the 38% line. Enter with the target to be either Fibonacci...
Ignored
Reldas that is good. There are signs all over the charts, but most will never pay attention, or understand what is before them. Fibo in a tool, not an indicator in the true sense of the word. Once what the charts are saying becomes clear all else that matters is sound MM. Hey these are just my views & nothing more. Your post just caught my eye & thought I would chime in. Your post reminds me of an old chinese
proverbs " It Is Better To Light A Candle Than To Curse The Darkeness." You have shed some light on the path.
_________________________________