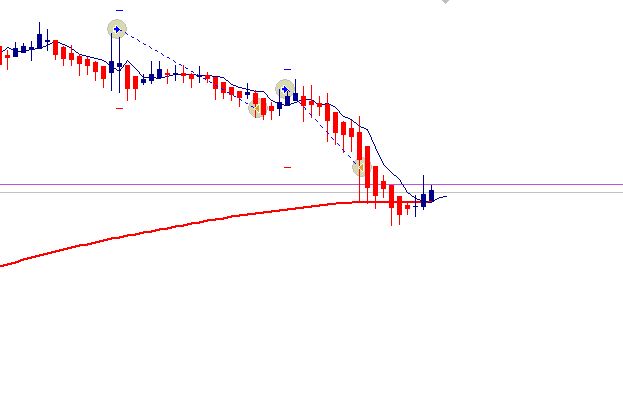
DislikedHere is one of mine in AJ,, had no idea of the future outcome of the candle as you can see, nor did/do I care, I was after 5pip. The trade itself was a bit risky (maybe not the best example here, sorry tk) as the rsi was nearing the 70. Price above the 200, the candle printed a low of .80 on my platform and at the time of trade the 5ema and candle bottom were touching, I took the trade and with spread (2.5) I got in at .83, got to 5 pip and I took profit,,, and as you can see about 10sec later someone wanted a boatload of AJ, but that's trading...Ignored
http://img.ie/images/hg6c6.png
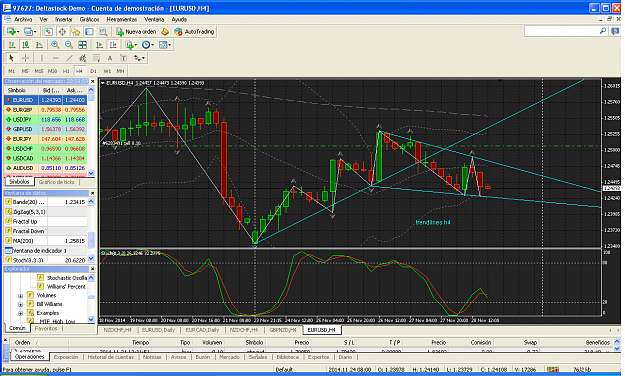
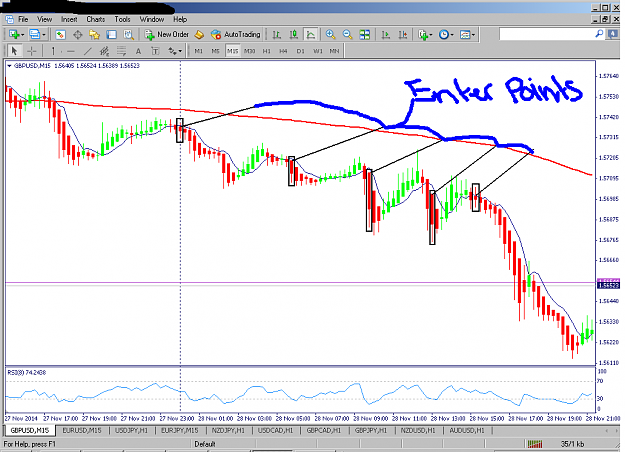
always draw trendlines