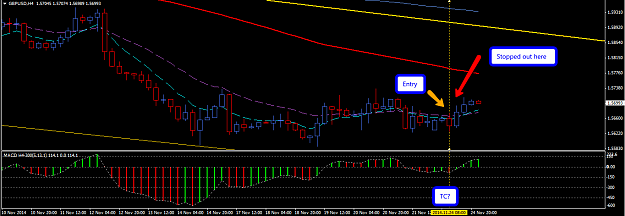
• Home
  • Forums
  • Trades
  • News
  • Calendar
  • Market
  • Brokers
  • Login
  • Join
  • User/Email: Password:
  • 10:57am
Menu
  • Forums
  • Trades
  • News
  • Calendar
  • Market
  • Brokers
  • Login
  • Join
  • 10:57am
Sister Sites
  • Metals Mine
  • Energy EXCH
  • Crypto Craft

Options

Bookmark Thread

First Page First Unread Last Page Last Post

Print Thread

Similar Threads

4 Hour Strategy Macd+other Indicator 21 replies

average true range for 1 hour and 4 hour charts 2 replies

X-1102 1 hour , 4 hour and daily Tf trades 7 replies

Create a verticle line at certain hour for every certain hour 16 replies

Is the "4 Hour Strategy (MACD)" the best system here at FF? 20 replies

  • Commercial Content
  • /
  • Reply to Thread
  • Subscribe
  • 12,927
Attachments: 4 Hour Strategy (MACD)
Exit Attachments
Tags: 4 Hour Strategy (MACD)
Cancel

4 Hour Strategy (MACD)

  • Last Post
  •  
  • 1 14231424Page 142514261427 1578
  • 1 Page 1425 1578
  •  
  • Post #28,481
  • Quote
  • Nov 13, 2014 2:21am Nov 13, 2014 2:21am
  •  yaakruay
  • | Joined Feb 2013 | Status: Member | 482 Posts
Quoting nic73
Disliked
{quote} I took the same trade and got taken out. My stop loss was slightly below 21ema. It was red news, and think that's why. How did you do with your, Richard? Nicholas
Ignored

hahaha..I got taken out too...but only had a 15 pip stop loss.

The reason i am laughing..and i do not take losing real money lightly or as a joke... BUT

I made the same trade a month or two ago but i sold and price went to the 89 that time...i think me and JonnyP did it.....

The reason I am laughing or shaking my head is that with the same picture i went the wrong way both times.....

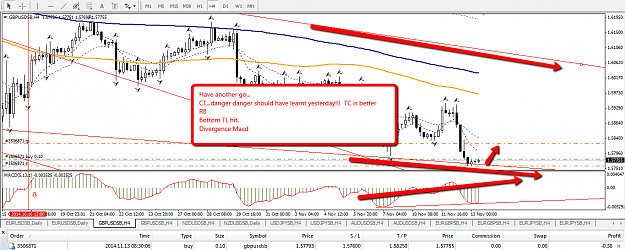
More luck next time....that GBP is a nightmare.....looking at the monthly i wonder if they will take it down even more...i thought it was ready to make a retrace up...

good luck
 
 
  • Post #28,482
  • Quote
  • Nov 13, 2014 2:39am Nov 13, 2014 2:39am
  •  yaakruay
  • | Joined Feb 2013 | Status: Member | 482 Posts
Quoting nic73
Disliked
{quote} I took the same trade and got taken out. My stop loss was slightly below 21ema. It was red news, and think that's why. How did you do with your, Richard? Nicholas
Ignored

I have been busy in life and not much time trading...Plus i took a break...

I made a trade on the GBP 29th Oct...

I went with a bull trade (my silly silly mistake...i thought the news release had gone at 2pm gmt...so i went with a long trade and thought it would take days/weeks..so i put a 100 pip stop loss....and then bang ! next time i opened my charts.....lost...

So i have been quiet and taking a rest and busy doing other stuff....

Live and learn...check those news releases out in your own time zone! duh !
Attached Image (click to enlarge)
Click to Enlarge

Name: 2014-09-19_0606.png
Size: 81 KB
 
 
  • Post #28,483
  • Quote
  • Nov 20, 2014 2:41pm Nov 20, 2014 2:41pm
  •  macdh4
  • | Joined Nov 2014 | Status: Member | 220 Posts
Hello everyone, I am new here, I'm from Portugal and discovered the system of Mr. Phillip Nel little while ago and have been operating in demo with good results.
Someone can tell me why Mr. Phillip never wrote here in the forum?
Anyone ever used this system?
Thank you all
 
 
  • Post #28,484
  • Quote
  • Nov 22, 2014 9:11am Nov 22, 2014 9:11am
  •  trademin
  • | Joined Apr 2007 | Status: Member | 910 Posts
Quoting macdh4
Disliked
Hello everyone, I am new here, I'm from Portugal and discovered the system of Mr. Phillip Nel little while ago and have been operating in demo with good results. Someone can tell me why Mr. Phillip never wrote here in the forum? Anyone ever used this system? Thank you all
Ignored
I am using his system,

welcome macdh4,

M.Nel has done a lot of work in here. What I can say is he has done a marvellous work. If you are “new” to trading then it is an excellent place to start learning here. You have a tremendous opportunity to build a strong base of knowledge. But the story doesn’t end there: on your own path of discovering “his” way of seeing the world of trading, as teached, you will learn to see and act on the rhythm. This is where the discovery really starts by being part of the spectators that is being able to feel the action that is going in There. You could be that someone that can participate in that very particular “ride” by seeing in advance (or Anticipating) the fall of a RT, TC or other figures (configurations) and then find the proper time to take advantage of that opportunity that presents to you by opening a position and just watch the development till you close that action to your benefit as planned…realizing that you just made a trade…This Is what I whish to you.
Yvon
 
 
  • Post #28,485
  • Quote
  • Nov 23, 2014 1:31pm Nov 23, 2014 1:31pm
  •  trademin
  • | Joined Apr 2007 | Status: Member | 910 Posts
Quoting nic73
Disliked
AUDNZD Sold this and caught a 47pips gain. Thought I should share this is allow for some comments, want to know if my analysis was alright and sound. And not making profit out of luck. Please leave your feedback and insight on this. Thank you. {image}
Ignored
Hi nic,
Sorry for taking that long to comment on your trade on AUDNZD.


The logic that you used is ok with me, and that was a good entry too by checking by zooming in(1hr,15min chart), when time is available, for a search for some hints that support your trade…I like it! I do that too! I am glad that you take the time to search for those confirmations it helps consolidate your possible trade. It is like if the chart itself helps you in your decision, a very kind conversation that the chart offers you!
R/R is about 1/1, which is ok too.
But where is coming from the yellow line chosen as target? I don't see it on your chart.

But since I haven’t the same platform, I have to see it a bit differently than yours.
So I draw a vertical dotted (pink) line crossing the candle (is it?) where you took the trade. On your chart it is indecisions candles sticking to the 365(just before your trade), no “bodies” that could show some strength, but a certain weakness on a moderate consolidation supporting a move down.(below the 89 and the 200)
But on mine as you can see, it is different: on the candle just before the trade, it is a bearish engulfing candle, showing a coming weakness, so expecting a move down…but leading to the same conclusion as yours.
Just before that candle (where you took the trade) there was a double TC shown on the macd, helping also to make your decision.

Nice trade! Congrat!
Attached Image (click to enlarge)
Click to Enlarge

Name: 141123AUDNZD.png
Size: 121 KB
Yvon
 
 
  • Post #28,486
  • Quote
  • Edited Nov 24, 2014 2:46am Nov 23, 2014 7:02pm | Edited Nov 24, 2014 2:46am
  •  trademin
  • | Joined Apr 2007 | Status: Member | 910 Posts
141116EURUSD

I consider this trade as a « continuity » of the trade started a while ago.
This is why I have loaded the daily chart first because the meaning is on the daily,easier to see too.

As a follow up, I was just looking for a pull back to the neckline(since there is a HS Known as 1-2-3) to open a short position again, which I did, as shown on the daily chart (yellow circle). I was not expecting a move much higher than my entry,(reaching the 21 ema daily) but later the price went closer to the downtrend line(pink) this is why I had to be patient some 5 days (!) before the price when down south again.
There are already some 145 pips secure for now.

At the level the price stand, the target has been reached already.( as per post 28462,the second chart).
The trade is still open since I believe the ride down is not over yet, but this is my view. Will see…

trade closed: 147 pips gain
Attached Image(s) (click to enlarge)
Click to Enlarge

Name: 141116EURUSD.png
Size: 124 KB
Click to Enlarge

Name: 141116EURUSD-2.png
Size: 148 KB
Yvon
 
 
  • Post #28,487
  • Quote
  • Edited 2:58am Nov 24, 2014 2:25am | Edited 2:58am
  •  trademin
  • | Joined Apr 2007 | Status: Member | 910 Posts
this trade is on the other platform---
essaie on the 15 min chart...

will see...
141124EURUSD-
that was a very short trade! just hit by SL (again too close) lost : 12 pips...too bad!
it is a good thing that I didn't add more lots in there!
that was crazy!
too fast sometime on the trigger,I'm going to sleep!
Attached Image (click to enlarge)
Click to Enlarge

Name: 141124EURUSD-15 min.png
Size: 117 KB
Yvon
 
 
  • Post #28,488
  • Quote
  • Nov 24, 2014 7:35pm Nov 24, 2014 7:35pm
  •  nic73
  • | Joined Feb 2013 | Status: Member | 439 Posts
Hi Yvon

Nice trade (post 28486) and thanks for replying to my post too. Hope you can spare us your time and post more of your trades here. I am learning a lot from you. It's true.

Here I have GBPUSD from yesterday, 24 Nov. I was observing this pair and traded for sell on Demo but got stopped out. I feel there was something not quite right about this pair and so decided to take it on demo only. So true enough, I got stopped out and SL. Need your insight here, why this pair did not make it to the south when it appeared on the 15min, 30min and 1Hr TF that the price was pulling away from 21ema.

Thanks
Attached Image (click to enlarge)
Click to Enlarge

Name: GBPUSD_H4_2014_24_Nov_2014.png
Size: 33 KB
 
 
  • Post #28,489
  • Quote
  • Nov 24, 2014 7:46pm Nov 24, 2014 7:46pm
  •  P1ps0mat
  • | Joined Aug 2013 | Status: Member | 21 Posts
Quoting nic73
Disliked
Hi Yvon Nice trade (post 28486) and thanks for replying to my post too. Hope you can spare us your time and post more of your trades here. I am learning a lot from you. It's true. Here I have GBPUSD from yesterday, 24 Nov. I was observing this pair and traded for sell on Demo but got stopped out. I feel there was something not quite right about this pair and so decided to take it on demo only. So true enough, I got stopped out and SL. Need your insight here, why this pair did not make it to the south when it appeared on the 15min, 30min and 1Hr...
Ignored
nic73: in my opinion the market at this point is ranging sideways. in this phases you will get stopped out frequently trying to enter the market like this. In Ranging Markets you need to be flexible and change your style. If I am not mistaken there is a chapter somewhere in this thread mentioning how to trade ranging markets using the MACD.
 
 
  • Post #28,490
  • Quote
  • Nov 24, 2014 9:30pm Nov 24, 2014 9:30pm
  •  nic73
  • | Joined Feb 2013 | Status: Member | 439 Posts
Quoting trademin
Disliked
141116EURUSD I consider this trade as a « continuity » of the trade started a while ago. This is why I have loaded the daily chart first because the meaning is on the daily,easier to see too. As a follow up, I was just looking for a pull back to the neckline(since there is a HS Known as 1-2-3) to open a short position again, which I did, as shown on the daily chart (yellow circle). I was not expecting a move much higher than my entry,(reaching the 21 ema daily) but later the price went closer to the downtrend line(pink) this is why I had to be patient...
Ignored
Hi Yvon,
It looked like, on post 28462, that you entered the trade after market has moved quite a fair bit (long candle). Which means stop loss could be huge. How do manage such a trade with such big stop loss? Did you enter after the close of the long candle or did you take a early entry? Thanks
 
 
  • Post #28,491
  • Quote
  • Nov 25, 2014 1:24am Nov 25, 2014 1:24am
  •  trademin
  • | Joined Apr 2007 | Status: Member | 910 Posts
Quoting nic73
Disliked
Hi Yvon Nice trade (post 28486) and thanks for replying to my post too. Hope you can spare us your time and post more of your trades here. I am learning a lot from you. It's true. Here I have GBPUSD from yesterday, 24 Nov. I was observing this pair and traded for sell on Demo but got stopped out. I feel there was something not quite right about this pair and so decided to take it on demo only. So true enough, I got stopped out and SL. Need your insight here, why this pair did not make it to the south when it appeared on the 15min, 30min and 1Hr...
Ignored
Hi nic,

Glad to read you.
As you can see, I make mistakes too!

But let’s say that I look to find trades in figures, while a consolidation don’t have figure. It gets pretty hard, for me, to do some anticipation, except that in a particular time, that consolidation will break, and that’s all I know about it. While usually a RT or TC or HS are having implied consequences, they get easier to trade or at least , look easier to find for some possible trades in there.
I have mentioned in the past that I like very much HS and I have shown some examples of trades in that kind of formations. I like it when there are “range”100 pips+. And I have seen HS delivers more than once 150pips+ and sometime more than that. –And the most important is the fact that even if I forget about the trade it gets to the target, I just wait , the pressure is under control and I stay in the trade, still by the 4hrs macd strategy because I know the trade is well set and targets are reachable! Just like the last trade in EURUSD.- I stay in because I know that everything support me to stay in that trade so I just went away.(…and really away!)
If a possible trade is less than 100 pips , I don’t trade that it or I will load more lots in it, or sometime, just take few lots to just teaching me to “let go” the trade, to experiment my own “patience” or experiment to just stay away while a specific trade is on.
And since I use 2 platforms it gets easier to experiment what are my behaviour in them.

If you look closely on the last 147 pips, I say that I had completely forgot about that trade until I looked at that platform later! –sure I am glad about the result, but in a sense I was really expecting that result. What I was not expecting in this trade is the total oversight of it!!! –And that I am not proud of!---so experimentations of some aspect of my behaviour needs “fine tuning” and while in fine tuning or experimenting, those trades are not quite in for the 4hrs macd strategy as such to show on the tread, because sometime trades are just “continuity” of the macd strategy applied earlier there. Just like lately I have been ask for my entry …I know that the tracks of the 4hrs macd strategy will lead somewhere and since it is not on a red bar, but still application of the macd strategy, I just don’t want to openly show them because it would not be a short talk to explain even if it is still the 4hrs macd strategy!
Sometime I will show the figure while showing the trade , with no explanation but the 4hrs macd strategy only …but right there traders can easily see the HS, then the projection and the target.

It is always part of the rhythm to bounce and this is where traders can anticipate what should be coming next. But if those bounces could be called “ripples”, don’t count me in!- ripples don’t get tsumamis.

The big idea is to be very familiar with the strategy, and being able to observe the market for hints of what should be coming next and to do so is to observe the rhythm of the market, it is a beauty!
But let’s say that I’ll do my best to show my trades that are good representation of the 4hrs macd strategy.
On your example (GBPUSD) for me, it is a consolidation, and if I read the ATR, it shows peaks at 63 pips or so. But those are peaks, so range could be a bit lower sometime, I would need to place orders in advance at a certain level and set SL and TP well in advance, which I am no expert in this. If I take the trade live to where would possibly be the entry, well, I am not that good in throwing darts, so my risk would be high while the profit low (Ho yes!, I know myself on that!)- but I know that some traders deploy their expertise in those formation and make money.

While there are some behaviours markets that look weird, I don’t look for the “why” as such. I just apply the strategy and act accordingly. Eventually the answer about the “Why” should come…loosing some trades are part of the game.

About your question concerning post 28462, I will get back to you about it. It is late now here in that part of Canada…I’m going to sleep!
Yvon
 
 
  • Post #28,492
  • Quote
  • Edited 8:43am Nov 25, 2014 7:05am | Edited 8:43am
  •  trademin
  • | Joined Apr 2007 | Status: Member | 910 Posts
AUDUSD: trade taken last night, expecting a nice ride down, but again, will see...

As mentionned: I could have taken trade at the RT at the close of the red candle.
EDIT: free ride now.
edit: about 12 pips secured
hope that some are enjoying the ride down

edit : secured about 27 pips
since there is a break of the neckline, I am now expecting a strong candle down, but this is my view... I have seen it quite some time, and maybe there is one in reserve for this trade...
Attached Image (click to enlarge)
Click to Enlarge

Name: 141125AUDUSD.png
Size: 133 KB
Yvon
 
 
  • Post #28,493
  • Quote
  • Edited 8:49am Nov 25, 2014 7:54am | Edited 8:49am
  •  trademin
  • | Joined Apr 2007 | Status: Member | 910 Posts
141125EURUSD:
another trade taken a bit in advance, some explanations. the 2 rectangles are having the same range. on the upper one, there is a HS leading to the bottom of the second rectangle. that is not part of the 4hrs macd strategy, but as example of what could be seen on the market.
I sold it on the pull back to 21 ema.
edit: free ride now
got hit by SL a bout 1 pip gain!---SL too close to action
got right back in
Attached Image (click to enlarge)
Click to Enlarge

Name: 141125EURUSD-1.png
Size: 146 KB
Yvon
 
 
  • Post #28,494
  • Quote
  • Nov 25, 2014 8:05am Nov 25, 2014 8:05am
  •  trademin
  • | Joined Apr 2007 | Status: Member | 910 Posts
Quoting nic73
Disliked
{quote} Hi Yvon, It looked like, on post 28462, that you entered the trade after market has moved quite a fair bit (long candle). Which means stop loss could be huge. How do manage such a trade with such big stop loss? Did you enter after the close of the long candle or did you take a early entry? Thanks
Ignored
there it is :
What is the figure on which I opened a trade on?
That is the question that comes to me in order to give you a logic answer.

I saw, first a bounce,(refost 28462) the big one that caught my attention first (look at the macd: that’s the only bounce above the zero line!), it is now known as the head, do you see that? If so, I just look around to see if that bounce was the first or the second (the head) or the third. It happens to be the second, since I saw one lower bounce just before the big one. So I knew, from that point that if there were to be a third bounce or third RT, that I could look now for clues to get short on it …but still didn't know when to get involve yet…
But already from there, it was easy to anticipate a third bounce
that will be called the right shoulder, or if you prefer the third RT.

At that point what the market is telling me?
The 21ema (in blue) is about flat…just like I see often while a pair is in consolidation, so I didn't expected a large move at that point.
What the macd is telling me then?
It clearly shows that the right shoulder could not make it over the zero line. So not bullish at all!
What now about the shoulders height on the candles?
On the 4hrs chart there was a trend line drawn in the sand that was coming from the high candle on the head that expand to the right kind of limiting the candle’s behaviour forming the third RT…
And from there I just short there.

Now the second entry:
I knew that I have already some pips gain from the first entry, so opening the door for some more entry, the risk was easy to make.
Now what would support that long SL?
I just draw the projected target obtain from a HS figure.( You can take example of 141125EURUSD above to see it in there too)
And just got confirmation that there was some more down move to come, putting some more trade in the wagon was quite easy to do.
Where the entries are : just look at the small red arrows on that strong candle.

that's my view. but those bounces are RT and if they fit in a HS, it gives you the opportunity to have an idea of the TP area and be able to measure a possible risk/reward value. Again those are RT and can be threaten as such
Yvon
 
 
  • Post #28,495
  • Quote
  • Nov 25, 2014 8:40am Nov 25, 2014 8:40am
  •  trademin
  • | Joined Apr 2007 | Status: Member | 910 Posts
141125-3EURUSD:

Do you see a possible HS in there ?if so a possible nice range down ,
Attached Image (click to enlarge)
Click to Enlarge

Name: 141125EURUSD-3.png
Size: 112 KB
Yvon
 
 
  • Post #28,496
  • Quote
  • Nov 26, 2014 8:19pm Nov 26, 2014 8:19pm
  •  nic73
  • | Joined Feb 2013 | Status: Member | 439 Posts
Quoting trademin
Disliked
AUDUSD: trade taken last night, expecting a nice ride down, but again, will see... As mentionned: I could have taken trade at the RT at the close of the red candle. EDIT: free ride now. edit: about 12 pips secured hope that some are enjoying the ride down edit : secured about 27 pips since there is a break of the neckline, I am now expecting a strong candle down, but this is my view... I have seen it quite some time, and maybe there is one in reserve for this trade... {image}
Ignored
You post triggered me to take a closer to this pair. And I learned something again from your view. Please see my comments with the chart. Also, realise I put the comment in MACD that says 'MACD signal?" - I meant to say there is no MACD signal at the point of my suggested entry, what do you say of this? And do leave me your comments on the overall analysis. Thank YVON
Attached Image (click to enlarge)
Click to Enlarge

Name: AUDUSD_H4_24_Nov_2014.png
Size: 67 KB
 
 
  • Post #28,497
  • Quote
  • Nov 27, 2014 1:19am Nov 27, 2014 1:19am
  •  nic73
  • | Joined Feb 2013 | Status: Member | 439 Posts
Quoting trademin
Disliked
{quote} there it is : What is the figure on which I opened a trade on? That is the question that comes to me in order to give you a logic answer. I saw, first a bounce,(refost 28462) the big one that caught my attention first (look at the macd: that’s the only bounce above the zero line!), it is now known as the head, do you see that? If so, I just look around to see if that bounce was the first or the second (the head) or the third. It happens to be the second, since I saw one lower bounce just before the big one. So I knew, from that point that...
Ignored
You wrote: I saw, first a bounce,(refost 28462) the big one that caught my attention first (look at the macd: that’s the only bounce above the zero line!), it is now known as the head, do you see that?

Which chart are you referring to, there are 3 in Post 28462? Don't see the bounce above zero you mentioned or the head and shoulder. Sorry, I need you to fill in the details.
 
 
  • Post #28,498
  • Quote
  • Nov 27, 2014 1:27am Nov 27, 2014 1:27am
  •  nic73
  • | Joined Feb 2013 | Status: Member | 439 Posts
[quote=trademin;7898409]141125-3EURUSD: Do you see a possible HS in there ?if so a possible nice range down , {image}[/quote
I would see it as (minor) double top. What do you say?

HS does not look perfect but then you gave me some better insight what SHS could look like, not always perfect of course. Thank you.
Attached Image (click to enlarge)
Click to Enlarge

Name: HS.png
Size: 125 KB
 
 
  • Post #28,499
  • Quote
  • Nov 27, 2014 2:25pm Nov 27, 2014 2:25pm
  •  trademin
  • | Joined Apr 2007 | Status: Member | 910 Posts
Quoting nic73
Disliked
{quote} You post triggered me to take a closer to this pair. And I learned something again from your view. Please see my comments with the chart. Also, realise I put the comment in MACD that says 'MACD signal?" - I meant to say there is no MACD signal at the point of my suggested entry, what do you say of this? And do leave me your comments on the overall analysis. Thank YVON {image}
Ignored

Hey! That was a nice Trade! you comment that you where afraid of entering the trade since price didn’t get below the 21ema: If I remember well, a RT is a RT, and the best place to take the trade is by the macd rule…on the spot you draw a yellow line, your were right! Right at the close of that double top!---just above the 200 could have you initial SL, and there you go,

A very nice trade!
Yvon
 
 
  • Post #28,500
  • Quote
  • Edited 2:55pm Nov 27, 2014 2:28pm | Edited 2:55pm
  •  trademin
  • | Joined Apr 2007 | Status: Member | 910 Posts
Quoting nic73
Disliked
{quote} You wrote: I saw, first a bounce,(refost 28462) the big one that caught my attention first (look at the macd: that’s the only bounce above the zero line!), it is now known as the head, do you see that? Which chart are you referring to, there are 3 in Post 28462? Don't see the bounce above zero you mentioned or the head and shoulder. Sorry, I need you to fill in the details.
Ignored
That was the EURUSD,( on the daily chart) but since then,on the 4hrs chart, 3 bounces are already made…and maybe,just maybe, it is ready the go down, but again, will see!
Yvon
 
 
  • Commercial Content
  • /
  • 4 Hour Strategy (MACD)
  • Reply to Thread
    • 1 14231424Page 142514261427 1578
    • 1 Page 1425 1578
1 member viewing:
llJustll
  • More
Top of Page
  • Facebook
  • Twitter
About FF
  • Mission
  • Products
  • User Guide
  • Media Kit
  • Blog
  • Contact
FF Products
  • Forums
  • Trades
  • Calendar
  • News
  • Market
  • Brokers
  • Trade Explorer
FF Website
  • Homepage
  • Search
  • Members
  • Report a Bug
Follow FF
  • Facebook
  • Twitter

FF Sister Sites:

  • Metals Mine
  • Energy EXCH
  • Crypto Craft

Forex Factory® is a brand of Fair Economy, Inc.

Terms of Service / ©2023