• Home
  • Forums
  • Trades
  • News
  • Calendar
  • Market
  • Brokers
  • Login
  • Join
  • User/Email: Password:
  • 4:09am
Menu
  • Forums
  • Trades
  • News
  • Calendar
  • Market
  • Brokers
  • Login
  • Join
  • 4:09am
Sister Sites
  • Metals Mine
  • Energy EXCH
  • Crypto Craft

Options

Bookmark Thread

First Page First Unread Last Page Last Post

Printable Version

Similar Threads

Similarity: A Practical Approach 858 replies

Rainbow similarity 255 replies

Similarity Trading - The ZZBB Method 212 replies

Similarity Stuff 17 replies

Directional Similarity 0 replies

  • Recycle Bin
  • /
  • Reply to Thread
  • Subscribe
  • 2,097
Attachments: The similarity system
Exit Attachments

The similarity system

  • Last Post
  •  
  • 1 607608Page 609610611 668
  • 1 Page 609 668
  •  
  • Post #12,161
  • Quote
  • Nov 12, 2014 11:19pm Nov 12, 2014 11:19pm
  •  cfdtaleong
  • | Additional Username | Joined May 2013 | 724 Posts
Attached Image


I don't know about some of the others but for me I found the call pretty easy to take. The picture says that for that 270min price will close above 1.2440 with 98%. In other words, for that period price will stay above 1.2440 mostly (1). Now it also says price has only 15% of reaching 1.2520...so putting a TP there would be rather silly since there is only a 15% of that happening (2). So.....pick a target from the other values that have a good probability duh ! 1.2470 looks good with 87% (3). That's like what 30 pips no? I only got 10 though cause I had to leave but hey you could have easily gotten it during that 270min window.

EDIT : THE PIC IS NOT VALID ANYMORE. IT WAS FOR LAST NIGHT. THIS POST IS TO ILLUSTARTE ONE WAY OF READING IT
I want more brain power!
  • Post #12,162
  • Quote
  • Nov 12, 2014 11:26pm Nov 12, 2014 11:26pm
  •  orid
  • Joined Jun 2013 | Status: Member | 608 Posts
Quoting Eurusdd
Disliked
{image}
Ignored
this is I believe the truth of the situation. Regards Orid peter
  • Post #12,163
  • Quote
  • Nov 12, 2014 11:26pm Nov 12, 2014 11:26pm
  •  humlux
  • | Joined Nov 2014 | Status: Member | 119 Posts
Quoting PiratePip
Disliked
{quote} i believe that kind of manipulation only happens in penny stocks. Forex market is WAY to big for anything like that.
Ignored
Perhaps...but then again even a paranoid can be followed.
candy is dandy but liquor is quicker
  • Post #12,164
  • Quote
  • Nov 13, 2014 12:02am Nov 13, 2014 12:02am
  •  spyderman
  • Joined Nov 2010 | Status: Snaggin' Some Pips | 2,138 Posts
Quoting cfdtaleong
Disliked
{image} I don't know about some of the others but for me I found the call pretty easy to take. The picture says that for that 270min price will close above 1.2440 with 98%. In other words, for that period price will stay above 1.2440 mostly (1). Now it also says price has only 15% of reaching 1.2520...so putting a TP there would be rather silly since there is only a 15% of that happening (2). So.....pick a target from the other values that have a good probability duh ! 1.2470 looks good with 87% (3). That's like what 30 pips no? I only got 10 though...
Ignored

I'm with you cfd...I entered twice at different numbers and made 50+ pips. Obviously didn't hold to the end. Take your profits while you can.
  • Post #12,165
  • Quote
  • Nov 13, 2014 12:26am Nov 13, 2014 12:26am
  •  cfdtaleong
  • | Additional Username | Joined May 2013 | 724 Posts
Quoting spyderman
Disliked
{quote} I'm with you cfd...I entered twice at different numbers and made 50+ pips. Obviously didn't hold to the end. Take your profits while you can.
Ignored
I want more brain power!
  • Post #12,166
  • Quote
  • Nov 13, 2014 12:35am Nov 13, 2014 12:35am
  •  NorthTrader
  • Joined May 2013 | Status: Digging deeper | 653 Posts
To all NinjaTrader users,

I've noticed that V2 of my TZPriceAnalysis indicator (posted earlier this week) has a small problem. The problem is that the "NinjaScript generated code" section at the bottom is missing. This doesn't prevent you from using the indicator on a chart, but if you are a coder it would prevent you from accessing it from another indicator or strategy. Therefore, I've fixed the problem and created V3 which is posted below. It's the same as V2 apart from that problem.
Attached File
File Type: zip TZPriceAnalysis_V3.zip   4 KB | 532 downloads

Because of this setback, V2 of my other indicator (TZBarAnalysis) won't be available until next week sorry.

For NinjaScript coders:
It took me some time to pinpoint the cause of the problem so I'll mention here just in case it's useful to someone. The problem was that the Decsription attribute of the namespace contained concatenated strings and escaped characters such as \" (double quote). I did this to make the Description (indicator label) easier to read in the GUI and in the code. However, it seems that there is a long-standing bug in NT that prevents the "NinjaScript generated code" from being regenerated if the Description is not continuous text. Maybe they'll fix this problem in NT8? I don't know. Strangely, it seems that the newline escape sequence (\n) is allowed, so I've left those in to help readability in the GUI at least.
You reap what you sow.
  • Post #12,167
  • Quote
  • Nov 13, 2014 12:47am Nov 13, 2014 12:47am
  •  Kenergy
  • | Joined Jul 2013 | Status: Member | 43 Posts
“If you want to find the secrets of the universe, think in terms of energy, frequency and vibration.” – Nikola Tesla

Saw this about 3 hours before EURUSDD told us we would be seeing TZ waves in January. Just saw it again and had to share it.
  • Post #12,168
  • Quote
  • Nov 13, 2014 1:07am Nov 13, 2014 1:07am
  •  LvCa
  • | Joined Oct 2014 | Status: Member | 174 Posts
Quoting PiratePip
Disliked
{quote} i believe that kind of manipulation only happens in penny stocks. Forex market is WAY to big for anything like that.
Ignored
www.cnbc.com/id/102169791#.
  • Post #12,169
  • Quote
  • Nov 13, 2014 1:15am Nov 13, 2014 1:15am
  •  BlackStack
  • | Joined Jan 2010 | Status: Member | 316 Posts
Quoting LvCa
Disliked
{quote} www.cnbc.com/id/102169791#.
Ignored
Yes, that is why the markets are not random. They are controlled. That fine is peanuts for them. The market is trillions of dollars traded every day.
  • Post #12,170
  • Quote
  • Nov 13, 2014 1:46am Nov 13, 2014 1:46am
  •  jmn5611
  • Joined Oct 2012 | Status: Trade Small, Win Big | 5,358 Posts
Quoting DavidRP
Disliked
{quote} mmm so the call was correct? 98% the price was supposed to close above 1.2440, after 270 min since his post. It closed below when that time elapsed. It was wrong, no problem, everybody can fail.
Ignored
Hi David, not going to pile on here, but there are several theorems in this thread. Transient zones can probably be promoted to axiom. If price fails to clear a zone, that is a statistical rare event. That is what we are working off of, so if the zone did not clear when you traded towards the zone, then it becomes clear to trade away from the zone. How a trader does this is up to them. As a multi level trader I use this idea to tell me when to cut losers. 98% is still a guarantee, but if the zone does not clear, it is strong indication of what to do next.

This is a conceptual thread, and it is a damned good one. Take it from a true skeptic of everything.

Since you're a stats guy, maybe you can contribute?
It's all in your head.
  • Post #12,171
  • Quote
  • Nov 13, 2014 2:05am Nov 13, 2014 2:05am
  •  jmn5611
  • Joined Oct 2012 | Status: Trade Small, Win Big | 5,358 Posts
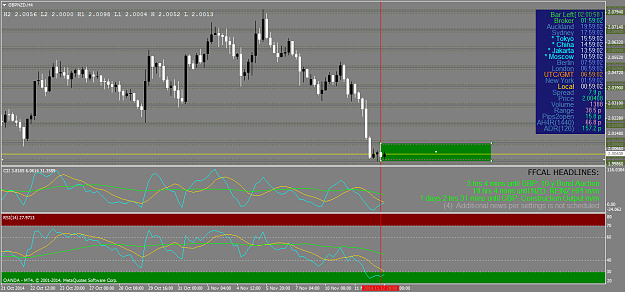
As one of the many ways to show the principle of similarity, we have a dissimilar bar here. Prices have an 81% probability of clearing this zone within a week once it moves away, one way or the other. If it doesn't clear, that's important. That all depends on where price is where time runs out. Some of this will sound very familiar to some of you.
Attached Image (click to enlarge)
Click to Enlarge

Name: GBPNZDH4.png
Size: 61 KB
It's all in your head.
  • Post #12,172
  • Quote
  • Nov 13, 2014 2:16am Nov 13, 2014 2:16am
  •  monty505
  • | Joined Mar 2014 | Status: Member | 39 Posts
It seems to me that I have been misunderstood, when I said 'not that good of a trader' I meant that there was this perception that every call put forward by EURUSDD was going to be a winner - was just pointing out that wasn't true, that he was a mortal after all. Anyways, you guys are doing an awesome job and making the most of your mathematical knowledge - your system is bit advanced for me and I'm just gonna stick with my own simple understanding of trading. Wish you all the best of luck.
  • Post #12,173
  • Quote
  • Nov 13, 2014 2:52am Nov 13, 2014 2:52am
  •  crashout
  • | Joined Oct 2006 | Status: Member | 373 Posts
Xixi, can i ask you to make a little modification on your indicator.

Can we keep all boxes that he draws instead of deleting some of them. I know it will probably clutter my screen, but for me this modification is essential.

Thanks !
  • Post #12,174
  • Quote
  • Nov 13, 2014 3:02am Nov 13, 2014 3:02am
  •  DavidRP
  • Joined May 2008 | Status: Member | 454 Posts
Quoting jmn5611
Disliked
{quote} Hi David, not going to pile on here, but there are several theorems in this thread. Transient zones can probably be promoted to axiom. If price fails to clear a zone, that is a statistical rare event. That is what we are working off of, so if the zone did not clear when you traded towards the zone, then it becomes clear to trade away from the zone. How a trader does this is up to them. As a multi level trader I use this idea to tell me when to cut losers. 98% is still a guarantee, but if the zone does not clear, it is strong indication of...
Ignored

Yep I can contribute, I have posted some results, but what I dont know is where the 98% come from, but I can't test that if EurUsdd doesn't explain it.

I use my own stats and as I said yesterday is very very rare to have the EURUSD daily range settled before US open. US market makers like making new daily lows/highs.
  • Post #12,175
  • Quote
  • Nov 13, 2014 3:04am Nov 13, 2014 3:04am
  •  xixi
  • Joined Aug 2012 | Status: Member | 224 Posts
Quoting crashout
Disliked
Xixi, can i ask you to make a little modification on your indicator. Can we keep all boxes that he draws instead of deleting some of them. I know it will probably clutter my screen, but for me this modification is essential. Thanks !
Ignored
Hi crashout,
I remember Sciurus has already developed such indicator.
Look at thread's attachments, you will see it.
  • Post #12,176
  • Quote
  • Nov 13, 2014 3:12am Nov 13, 2014 3:12am
  •  xixi
  • Joined Aug 2012 | Status: Member | 224 Posts
Quoting blueface
Disliked
{quote} Hi xixi if we can change the text color,I want to change to black.. I mean the text..
Ignored
here you are
added option: stats_color
Attached File
File Type: mq4 xixi_tz_1_9.mq4   21 KB | 814 downloads
  • Post #12,177
  • Quote
  • Nov 13, 2014 3:39am Nov 13, 2014 3:39am
  •  borsatyfx
  • | Joined Jan 2014 | Status: Member | 3 Posts
Quoting xixi
Disliked
{quote} here you are added option: stats_color {file}
Ignored
XiXi thanks for your effort can you make the indicator to draw rectangle (dotted line ) including the high or the low of the previous h as appear in Kiads and draw center line
I appreciate your effort in helping other
  • Post #12,178
  • Quote
  • Nov 13, 2014 4:03am Nov 13, 2014 4:03am
  •  Eurusdd
  • | Membership Revoked | Joined Oct 2012 | 2,254 Posts
Quoting cfdtaleong
Disliked
{image} I don't know about some of the others but for me I found the call pretty easy to take. The picture says that for that 270min price will close above 1.2440 with 98%. In other words, for that period price will stay above 1.2440 mostly (1). Now it also says price has only 15% of reaching 1.2520...so putting a TP there would be rather silly since there is only a 15% of that happening (2). So.....pick a target from the other values that have a good probability duh ! 1.2470 looks good with 87% (3). That's like what 30 pips no? I only got 10 though...
Ignored
That is another way to see it too. The think is for "closing prices". so for the period of 270 mins, eurusd was expected to close above 1.24400 98% of the time. At the end of the period, the probability is still 98% but then that means that there is still a 2% chance it may end lower at the end!
  • Post #12,179
  • Quote
  • Nov 13, 2014 4:07am Nov 13, 2014 4:07am
  •  Geros
  • | Joined Nov 2014 | Status: Member | 69 Posts
See Chart. I seekers. I look stochastic difference.

I would first Templar Eurusdd parameters. I can not open the file. 3d exceptional. I study but it is difficult.

Geros
Annulla modifiche
See Chart. I seekers. I look stochastic difference.

I would first Templar Eurusdd parameters. I can not open the file. 3d exceptional. I study but it is difficult.
Annulla modifiche
  • Post #12,180
  • Quote
  • Nov 13, 2014 4:10am Nov 13, 2014 4:10am
  •  blueface
  • Joined Sep 2014 | Status: Member | 234 Posts
Quoting xixi
Disliked
{quote} here you are added option: stats_color {file}
Ignored
awesome,my friend
thx again.
  • Recycle Bin
  • /
  • The similarity system
  • Reply to Thread
    • 1 607608Page 609610611 668
    • 1 Page 609 668
0 traders viewing now
  • More
Top of Page
  • Facebook
  • Twitter
About FF
  • Mission
  • Products
  • User Guide
  • Media Kit
  • Blog
  • Contact
FF Products
  • Forums
  • Trades
  • Calendar
  • News
  • Market
  • Brokers
  • Trade Explorer
FF Website
  • Homepage
  • Search
  • Members
  • Report a Bug
Follow FF
  • Facebook
  • Twitter

FF Sister Sites:

  • Metals Mine
  • Energy EXCH
  • Crypto Craft

Forex Factory® is a brand of Fair Economy, Inc.

Terms of Service / ©2021