If there is "Red Sell and Green Buy" indicator i am waiting for .......( but i am an analyst not programmer)
The imagination of the indicator to simplified the set up and analysis for DSS set up is like this:
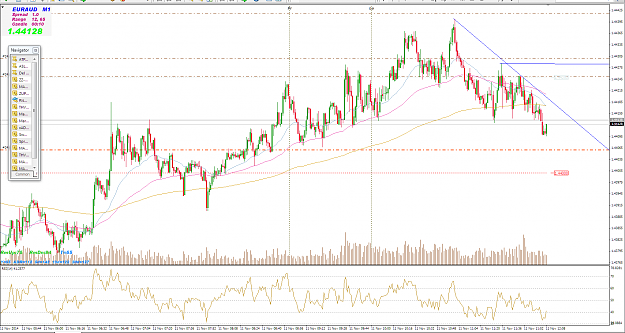
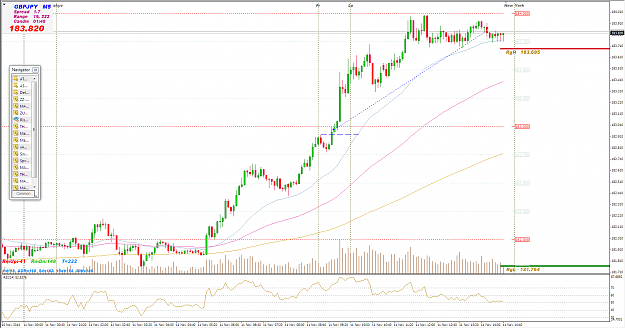
based on EMA 34 & 89 and each TF from1 M to Month....
TF 1M one Red Arrow down if price below 89EMA, two arrow down if price below 34 & 89 Ema, arrow change to yellow when touch EMA (34/89)...one Green arrow up if price above 89 EMA , two arrow green if price above 34 & 89 EMA, arrow change to pink if touch 34/89 EMA...etc (each time frame have indicator like above)...so will be indicator based each TF depend our analysis.
By doing manually...now,we should see multi time frame... to see pattern & EMA ( lazy trader
 )
)
The imagination of the indicator to simplified the set up and analysis for DSS set up is like this:
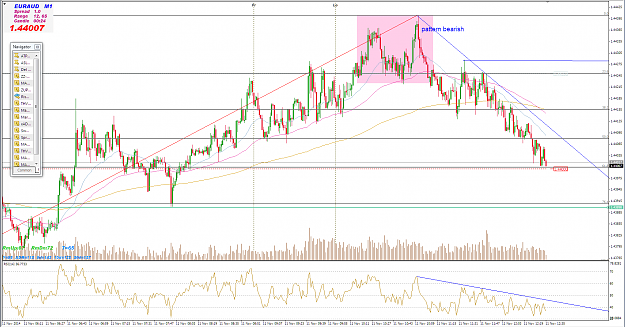
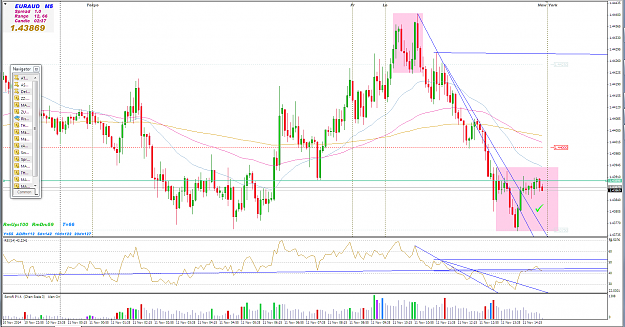
based on EMA 34 & 89 and each TF from1 M to Month....
TF 1M one Red Arrow down if price below 89EMA, two arrow down if price below 34 & 89 Ema, arrow change to yellow when touch EMA (34/89)...one Green arrow up if price above 89 EMA , two arrow green if price above 34 & 89 EMA, arrow change to pink if touch 34/89 EMA...etc (each time frame have indicator like above)...so will be indicator based each TF depend our analysis.
By doing manually...now,we should see multi time frame... to see pattern & EMA ( lazy trader
While knowledge speak up, the wisdom listen down