{quote} If you are buying EURNZD, that means you are shorting NZD which has higher interest rate. This will give you negative swap, not a positive one, so you'll be charged swap fee. Regards, Blackeagle
Ignored
woops my bad, will edit post & fix that.
Tnx for pointing it out
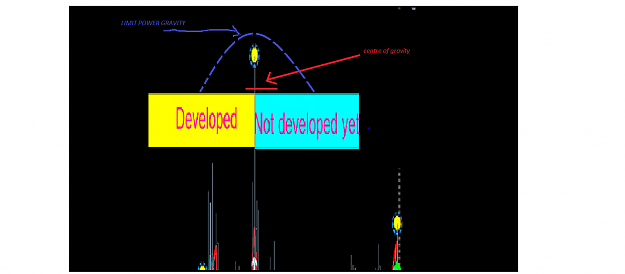
uhmm .. last night I thought of one thing: if we know a point of attraction then it might be useful to know a totally abandons the point where power ends. This, to me it might be useful, for example, to find a good place to stop loss. Around I found the indicator COG (Centre of graity) but I do not like it very much because I want the center to remain fixed on one point ... Excuse me guys, and 'just a thought ... but what do you think about this?
Ignored
It is a great idea! I too have been trying to find a "time factor" type stoploss when it comes to similarity if that's what you mean, no luck yet but it is something that would be a game changer
A Positive Mind, and Positive Spirit lead to True Happiness
{quote} {quote} Hey again FX-Jay, thanks for sharing your call! If you wouldn't mind could you tell us what in this thread has improved your trading the most, TZ, similarity or perhaps a post that gave you new perspective? And lastly do you do Multitime frame analysis or prefer sticking to 1 timeframe.
Ignored
Hey Rparm,
I am exclusively using the TZ/Probability concept.
I recently regained my interest in Similarity after Metacoder shared his Wormhole EA. However, my calls & results have nothing to do with it.
Rahimseven made a great job by compiling all the important statements mentioned by EURUSD into 1 or 2 PDFs. I don't think you need anything more than those statements to guide you the same way I was guided. The thread has so many ideas that are thrown left and right. Some are right, some are wrong, and some are just misleading. My advice is to do your own testing on every idea presented here before trading it live. If you don't have time for doing some extensive testings like I did (could take endless hours/days/weeks to get it right), then stick with ideas that are back by previous live calls or account statements.
Concerning Multi TFs, I have tried taking that path, but ended up sticking to 1 TF since it proved to be very profitable for me. I'm not saying that Multi TF analysis is not good, it could actually make me even more profitable, but since I'm more than happy with my results, I'll stick to mastering and improving what I am doing with single TF. I am currently using H4 TFs exclusively for signals, and lower TFs just for an accurate entry after getting the signal.
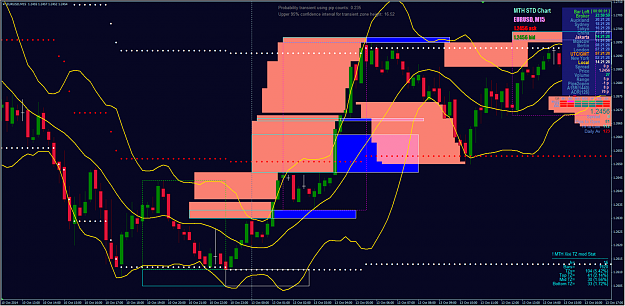
{quote} Hey cfdtaleong (http://www.forexfactory.com/cfdtaleong) If BB will cut the PTZ it would also cut the middle bar. Except for that one thing we interpret it the same way. But you will never have such a vertical BB cut like on the left side on your picture (I have tested it with backtester). And right side of PTZ isn`t supposed to be formed yet (not like on your picture). I really would like to see (and trade) that impressive edge you see, but I can`t see it no matter how hard I try... But now let`s have some fun: Bernard Hopkins...
Ignored
Attached Image (click to enlarge)
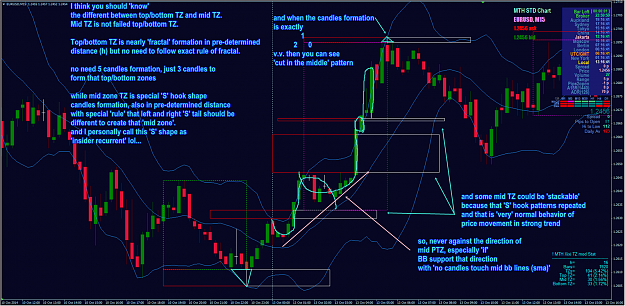
ok, and this is same picture with Sciurus v.1.7 h left and right =16, the rest is default and channel = 4
i combined with my Xixi TZ v.1.6 mod h = 16, and BB =16
and all of this is not 'counter trade' but 'following trade' if you can see what i see.. and yes my best indicators is my brain and my old eye..
and of course my more than 15 years hard experiences.. in this financial market that can support solely my standard of living with my family in my country.. lol
{quote}The thread has so many ideas that are thrown left and right. Some are right, some are wrong, and some are just misleading. My advice is to do your own testing on every idea presented here before trading it live. If you don't have time for doing some extensive testings like I did (could take endless hours/days/weeks to get it right), then stick with ideas that are back by previous live calls or account statements.
Ignored
Two more things to add to the above:
1- There are 3 main concepts being discussed in this thread which are Similarity, TZ, and Sub-sequence Theorem
Each of those concepts have many "sub-levels".
Lots of people are mixing between the three and their sub-levels. Others are trying to integrate all 3 together.
My advice is to focus on one at a time, master it, and then move onto the other & try integrating them together to have an extremely powerful tool.
2- There are many 'unproven' ideas that are being shared about how to use the above theories. In my opinion the more ideas the better. However, a word of caution to the newbies, you can't trust those ideas until you test them extensively either manually or through an EA/backtester. The problem is that no one is patient enough to test & almost everyone is jumping onto the next new thing and forgetting about the basics.
Read the thread from beginning to end not vice versa.
{quote} It is a great idea! I too have been trying to find a "time factor" type stoploss when it comes to similarity if that's what you mean, no luck yet but it is something that would be a game changer
Ignored
I do not know if I understand what you mean, because it 's based on the concept of TZ (not similarity ).
If I understand TZ correctly , there is 'a stop-loss period (H limit), but the concept of gravity' could also give a stop on the space .
This perhaps can 'help me to understand what I mean
{quote} However, a word of caution to the newbies, you can't trust those ideas until you test them extensively either manually or through an EA/backtester. The problem is that no one is patient enough to test & almost everyone is jumping onto the next new thing and forgetting about the basics. Read the thread from beginning to end not vice versa. Best, Jay
{quote} Two more things to add to the above: 1- There are 3 main concepts being discussed in this thread which are Similarity, TZ, and Sub-sequence Theorem Each of those concepts have many "sub-levels". Lots of people are mixing between the three and their sub-levels. Others are trying to integrate all 3 together. My advice is to focus on one at a time, master it, and then move onto the other & try integrating them together to have an extremely powerful tool. 2- There are many 'unproven' ideas that are being shared about how to use the above theories....
Ignored
Read Jay’s posts from beginning to end too. There aren’t that many and every one’s a winner. It’s the least you can do if you want to master TZs. And don’t forget the golden rule that Jay stresses over and over again: money management is the key
For any one interested I made this last weekend. Its every post by FX-Jay(minus his most recent ones). https://docs.google.com/document/d/1Y3E7eU9LCtDm2Ehzq7RinrKG4uOjObnTDZKXmeHrLpI/edit?usp=sharing I tried to upload to forum but was too big.
Ignored
Ha ha, you've just saved a lot of people a lot of work! (but you were too late for me )
{quote} Awesome thank you very much sir! {quote} nailed it. finally bagged a sizable trade using these theories presented here. This stuff works like magic! Thanks again for EurUsdd and every one else iv been pming the past few days to help me understand these concepts. you guys are all amazing! Pip {image} {image}
Ignored
At the begining of sub-sequence theorem EURUSDD gave this example:
"For example, suppose you chose your reals to be high of bars. The on the daily chart if you set n=2 then you need to look in the DNA for 5 bars. Let us suppose the highs of the last 4 bars are 1.2344, 1.2566, 1.2211, 1.2222, ????? What will be ?????
Since there must be a decreasing or increasing 3-subsequence, the high of the next bar must be above 1.2222 or below 1.2211.
Just two options."
So I understood, that when we have 4 bars, which don't meet 4 conditions of sub-sequence, then we can predict if the next candle will be below or above some previous price with 93.75 % probability.
But I don't understand, why those 'rare' sub-sequence numbers will be targets in the future.
Regards, IenDzi.
{quote} At the begining of sub-sequence theorem EURUSDD gave this example: "For example, suppose you chose your reals to be high of bars. The on the daily chart if you set n=2 then you need to look in the DNA for 5 bars. Let us suppose the highs of the last 4 bars are 1.2344, 1.2566, 1.2211, 1.2222, ????? What will be ????? Since there must be a decreasing or increasing 3-subsequence, the high of the next bar must be above 1.2222 or below 1.2211. Just two options." So I understood, that when we have 4 bars, which don't meet 4 conditions of sub-sequence,...
Ignored
I believe it is because the price is unbounded meaning no matter how it sequences it will never just move up or down. it will always be back and forth, which parallels TZ theory.
This may be very wrong just my understanding so far. I am still trying to really figure out the SS theory still.
Life's Good & Why Wouldn't It Be? Im a Pirate After All!
Thanks to PiratePip (http://www.forexfactory.com/piratepip) and to Fx-Jay and of course for EURUSDD and Kiads
I save the file for FX-Jay posts as Pdf i downloade it from the link of PiratePip (Thanks for him)
Thanks to PiratePip (http://www.forexfactory.com/piratepip) and to Fx-Jay and of course for EURUSDD and Kiads I save the file for FX-Jay posts as Pdf i downloade it from the link of PiratePip (Thanks for him) {image}
Ignored
thank you for compiling so can be saved on forum.
also beast trade explorer return...
Life's Good & Why Wouldn't It Be? Im a Pirate After All!
{quote} {quote} Hello Cfdtaleong, if you could show a chart with sciurus indicator and BB indi and show where you would enter your trade it would clarify much for me and for others that are struggling.
Ignored
Sorry no chart I post can be better than Kiads. If you see his chart at #11867 the top TZ, I would have entered at the close of the mid bar or the close of bar the after if my eyes can see the BB cut the forming TZ at that time.
Edit : I think there might be some logic conflict here where 1)We expect PTZs to end up not being TZs based on rules but 2)We are proposing to trade a PTZ expecting it to become a TZ. So this is where the PTZ position in relation to BB come in I guess
{quote} Two more things to add to the above: 1- There are 3 main concepts being discussed in this thread which are Similarity, TZ, and Sub-sequence Theorem Each of those concepts have many "sub-levels". Lots of people are mixing between the three and their sub-levels. Others are trying to integrate all 3 together. My advice is to focus on one at a time, master it, and then move onto the other & try integrating them together to have an extremely powerful tool. 2- There are many 'unproven' ideas that are being shared about how to use the above theories....
Ignored
I think you are right, I will post no more my idea until I try it yourself (for a good time). I just wanted to be helpful, but I understand that I may be wrong and annoying (I'm sorry )
So I will continue to read in silence, as before, hoping to post the facts .
{quote} Hey cfdtaleong (http://www.forexfactory.com/cfdtaleong) If BB will cut the PTZ it would also cut the middle bar. Except for that one thing we interpret it the same way. But you will never have such a vertical BB cut like on the left side on your picture (I have tested it with backtester). And right side of PTZ isn`t supposed to be formed yet (not like on your picture). I really would like to see (and trade) that impressive edge you see, but I can`t see it no matter how hard I try... But now let`s have some fun: Bernard Hopkins...
Ignored
Well best way to test is for market to open and see how it works I guess. My pictures are sketches at best so don't take them well....too literally lol. The whole idea is to illustrate my interpretation of a PTZ BB cut. As long as it cuts close I'm happy and I don't really need a right side to "see" at this point but if using Xixi or Freefox's indy the PTZ will do well too.
{quote} Hi Juri, I think this very powerful concept is not easy (especially for me ). I saw at the code provided by some mates here, and the rule is some thing like this : {quote} So, we are looking for the high (if up trend) and low (if down trend). 1) How can we know that it is in up trend or down trend at the moment (in coding, without looking at the chart) ? Do we use EMA ? 2) In the picture below, there are LH,HH,LH,HH and HL,LL,HL,LL .... which one should we use ? Hm .... still need time to understand this...... Thanks {image}
Ignored
Yes the code verifies the theorem applied to the high and low.
But you should separate those. Sub-sequence theorem for highs or lows, better not to mix those together, hence it doesn't matter if we are in a downtrend or uptrend.
And it is not possible to predict the next bar's high or low. The only thing we now for sure, the after 5 bars invalidated the theorem, we know the next 5 bars have high probability to validate the theorem. What to do with this information? Still don't know.
{quote} Yes the code verifies the theorem applied to the high and low. But you should separate those. Sub-sequence theorem for highs or lows, better not to mix those together, hence it doesn't matter if we are in a downtrend or uptrend. And it is not possible to predict the next bar's high or low. The only thing we now for sure, the after 5 bars invalidated the theorem, we know the next 5 bars have high probability to validate the theorem. What to do with this information? Still don't know.
Ignored
I understand this: if 5 bars invalidated theorem, the 6th bar has high probability to validate the theorem(I don't think, that needed next 5 bars, you can take last 4 bars from previous invalidated 5 bars and current 6th bar and it will be new 5 bar sequence).
{quote} Sorry no chart I post can be better than Kiads. If you see his chart at #11867 the top TZ, I would have entered at the close of the mid bar or the close of bar the after if my eyes can see the BB cut the forming TZ at that time. Edit : I think there might be some logic conflict here where 1)We expect PTZs to end up not being TZs based on rules but 2)We are proposing to trade a PTZ expecting it to become a TZ. So this is where the PTZ position in relation to BB come in I guess Will try to show examples next week if I trade.
Ignored
Hi Cfd ,that sort of trade might be risky as I think you are trading the low probability part my 2 cents
RegardsOrid peter
Oh sorry just saw your edit