Hi
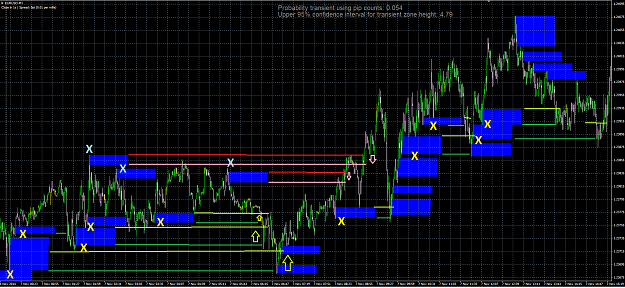
I would like to share my idea that comes from EURUSDD and from autocorrelation:
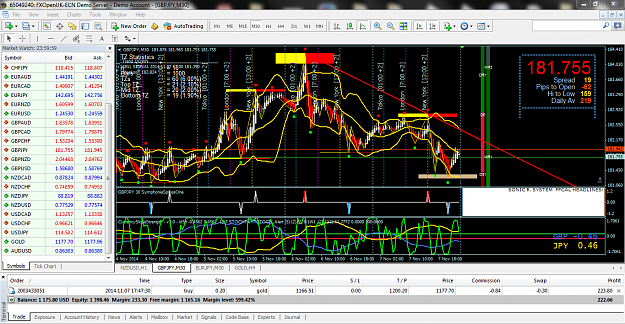
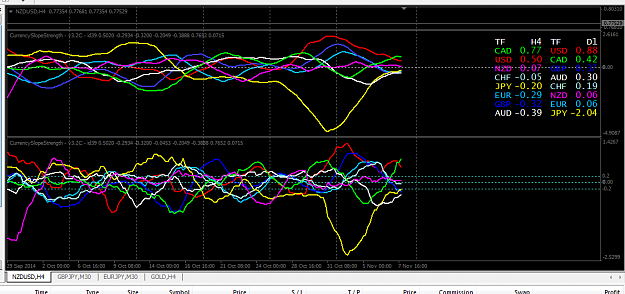
As you can see time frames are in a 3:1 ratio and also the parameters for the trading system
that was applied to both graphs
in the lower graph there are 2 more signals than the upper, because of the Similarity/Dissimilarity
concept shared by EURUSDD.
EURUSDD has teached to use these situation in order to "close the error"... it means that there
I can buy at the first Red sell arrow and then flattening the position at the Blue arrow.
It seems perfect, because the successfull trades could be in high %, but I would like to have more
user trying it and discuss it.
Thank you
I would like to share my idea that comes from EURUSDD and from autocorrelation:
As you can see time frames are in a 3:1 ratio and also the parameters for the trading system
that was applied to both graphs
in the lower graph there are 2 more signals than the upper, because of the Similarity/Dissimilarity
concept shared by EURUSDD.
EURUSDD has teached to use these situation in order to "close the error"... it means that there
I can buy at the first Red sell arrow and then flattening the position at the Blue arrow.
It seems perfect, because the successfull trades could be in high %, but I would like to have more
user trying it and discuss it.
Thank you
Attached Image (click to enlarge)