For pondering and development. MM, trade entries, management and exits are your own secret. Decided to leave this nugget of info on the thread for those who may need a spark. This is but one understanding. Be careful as this is but a piece of the puzzle. Thanks for the kind PM's. 7 {image}
Ignored
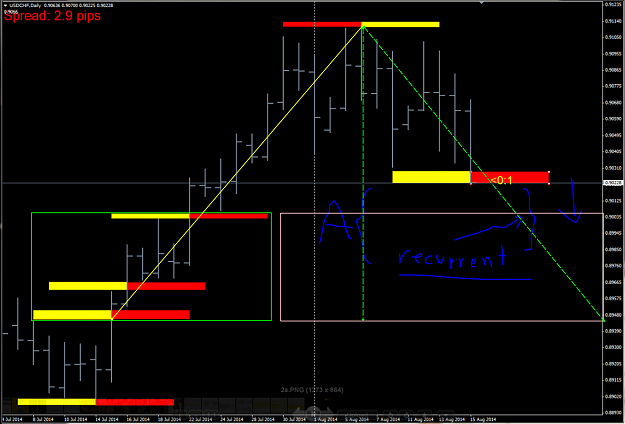
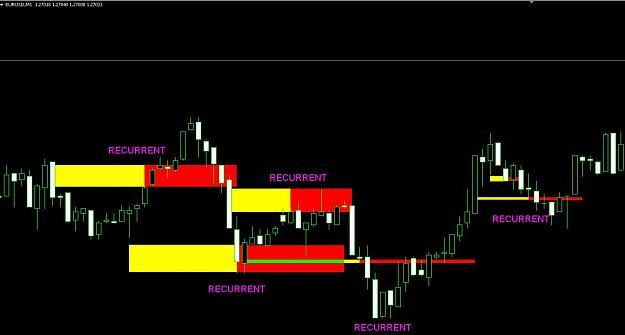
i think i need some confirmation on my understanding on PTZ with k and recurrent zone..
from the 'eureKa' pdf,
does that mean the PTZ itself is represented by 2parts - k and recurrent zone
which means k is actually the real potential transient zone?
{quote} i think i need some confirmation on my understanding on PTZ with k and recurrent zone.. from the 'eureKa' pdf, does that mean the PTZ itself is represented by 2parts - k and recurrent zone which means k is actually the real potential transient zone? did i get it right?
{quote} i think i need some confirmation on my understanding on PTZ with k and recurrent zone.. from the 'eureKa' pdf, does that mean the PTZ itself is represented by 2parts - k and recurrent zone which means k is actually the real potential transient zone? did i get it right?
Ignored
Yes.
K will serve as the Assumed transient zone. This allows us to reap the recurrent rewards of the active center bar.
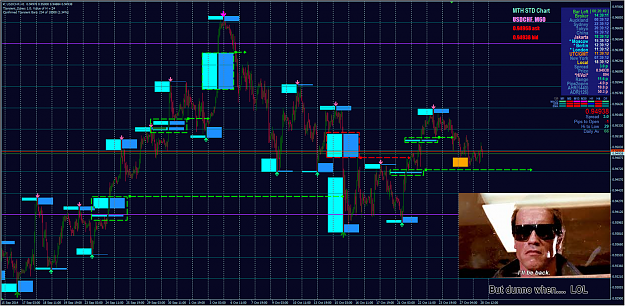
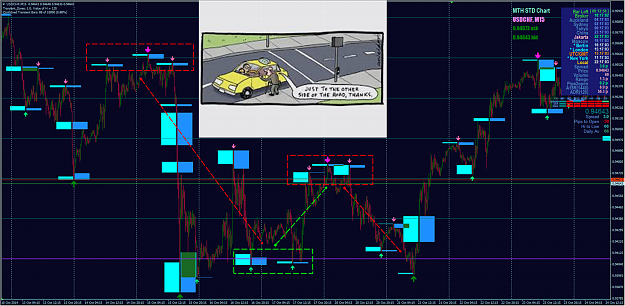
Thank you for the information and help you provide here. I saw your charts 15M and 1H and both have different h-value (15 has 120 and 1H has 24). My question is how you have defined these numbers, or is it randomly? if you are not comfortable answering my question, no worries. I just want to understand h theory. Many thanks..
{quote} Hi Kiads, Thank you for the information and help you provide here. I saw your charts 15M and 1H and both have different h-value (15 has 120 and 1H has 24). My question is how you have defined these numbers, or is it randomly? if you are not comfortable answering my question, no worries. I just want to understand h theory. Many thanks.. Bomi
Ignored
There isn't any rule for this, but it looks like he is using time equivalents.
1 day = 24 hours
30 hours = 120 x 15 min
A pip is only worth it if you know how much you risked to earn it
{quote} Hi Kiads, Thank you for the information and help you provide here. I saw your charts 15M and 1H and both have different h-value (15 has 120 and 1H has 24). My question is how you have defined these numbers, or is it randomly? if you are not comfortable answering my question, no worries. I just want to understand h theory. Many thanks.. Bomi
I had not seen this post (although I think I am subscribed to your thread but not sure).... anyway, yes, this is a great way to do it - I've done this as well!
This is why I always tell people to look at higher timeframes.
#4 Multiple Timeframes Seasoned traders know this rule: Higher Timeframes are more powerful than Lower Timeframes.
Ignored
Time Equivalence is something that can first be seen in Eurusdd's studies of Stochastics and then CI and then ZZ and Bollinger. Similarity!! Indicators to show "similar" representation on the same chart. To be able to put equivalent Weekly chart but on 15M timeframe.... not same, but similar.
A pip is only worth it if you know how much you risked to earn it
{quote} Time Equivalence is something that can first be seen in Eurusdd's studies of Stochastics and then CI and then ZZ and Bollinger. Similarity!! Indicators to show "similar" representation on the same chart. To be able to put equivalent Weekly chart but on 15M timeframe.... not same, but similar.
Ignored
Attached Image
Attached Image
because dance is similarity with many variations step....
MTH