Final on Saturday 25OCT2014,
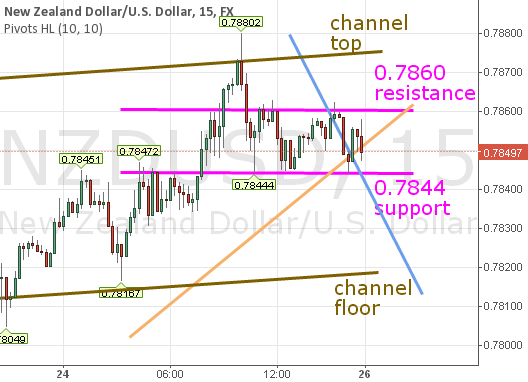
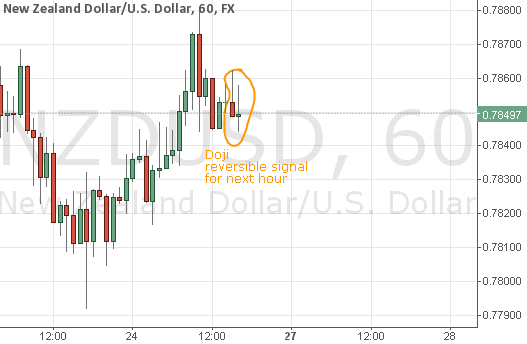
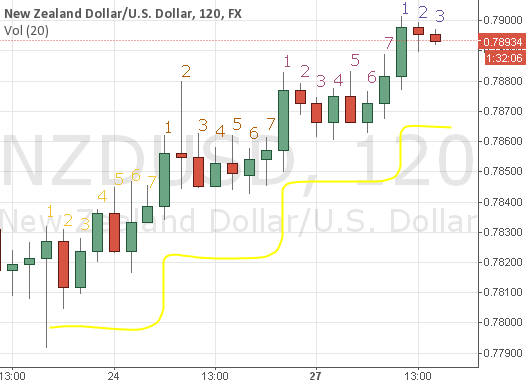
The above chart is 15 minute chart for NZD/USD.
golden lines are channel top line and channel floor line.
0.7860 is the current resistance.
0.7844 is the current support.
Orange line is the uptrend line.
Blue line is the downtrend line.
*********
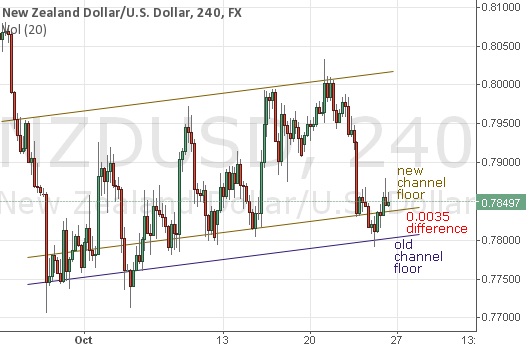
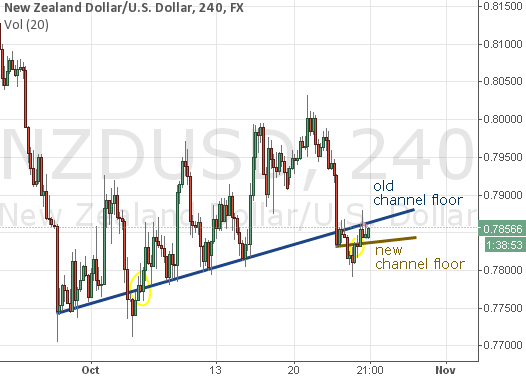
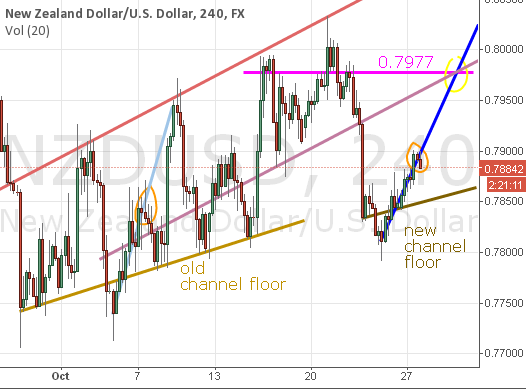
The above chart is 4 hour chart for NZD/USD.
golden lines are the new/current channel top line and the new/current channel floor line.
violet line is the old channel floor line.
the difference between old channel floor line and new/current channel floor line is 0.0035 in value.
*********
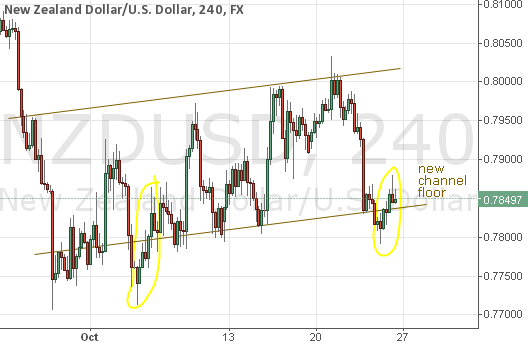
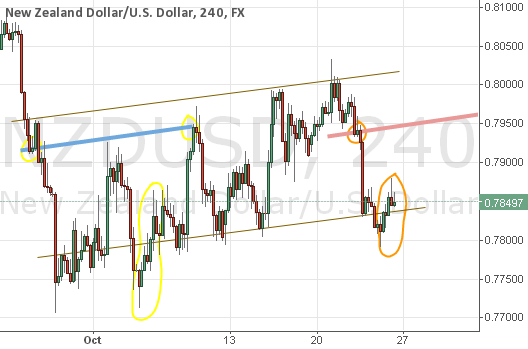
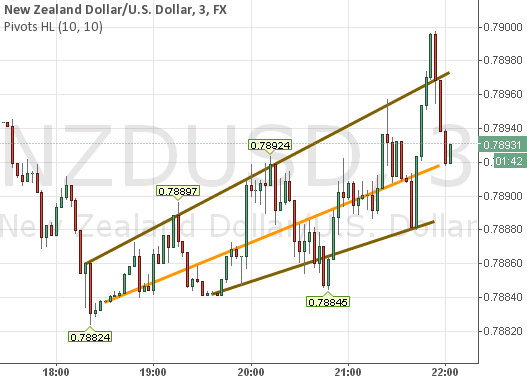
The above chart is 4 hour chart for NZD/USD.
golden lines are the new/current channel top line and the new/current channel floor line.
Yellow circles are marked as reference.
Attached Image
The above chart is 15 minute chart for NZD/USD.
golden lines are channel top line and channel floor line.
0.7860 is the current resistance.
0.7844 is the current support.
Orange line is the uptrend line.
Blue line is the downtrend line.
*********
Attached Image
The above chart is 4 hour chart for NZD/USD.
golden lines are the new/current channel top line and the new/current channel floor line.
violet line is the old channel floor line.
the difference between old channel floor line and new/current channel floor line is 0.0035 in value.
*********
Attached Image
The above chart is 4 hour chart for NZD/USD.
golden lines are the new/current channel top line and the new/current channel floor line.
Yellow circles are marked as reference.