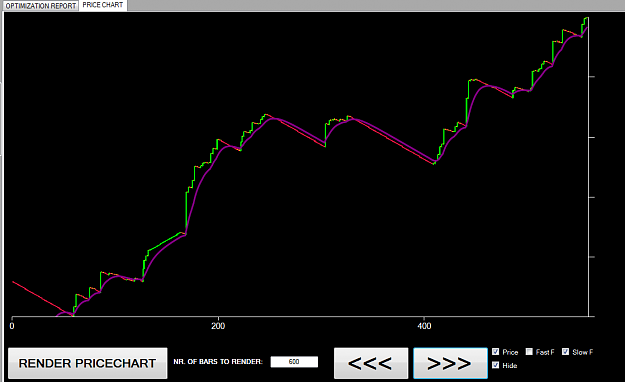
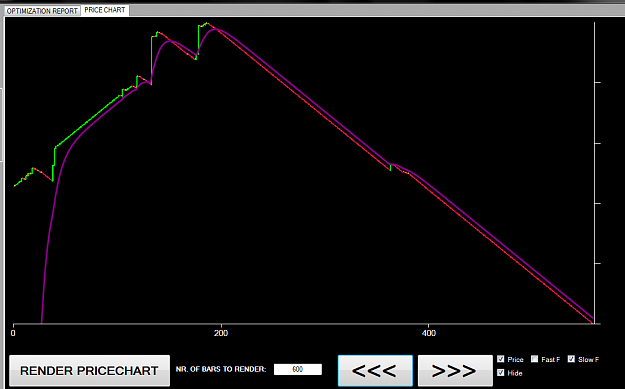
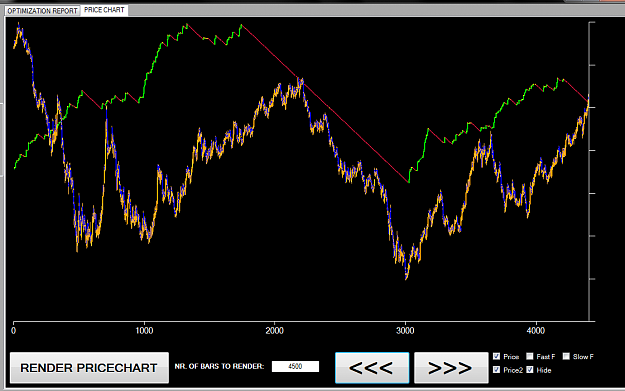
Ok so far, my research is pretty much capped as the problem with the price is that it's too choppy, no matter what filter I put in, those nasty spikes always get around it.
Adding 2-3 filters to filter them out would only cause more lagg and would not improve my performance, so I decided to transform the price itself, using various methods: Renko,CBR,Kagi,Log chart, etc and see if my results do improve or not.
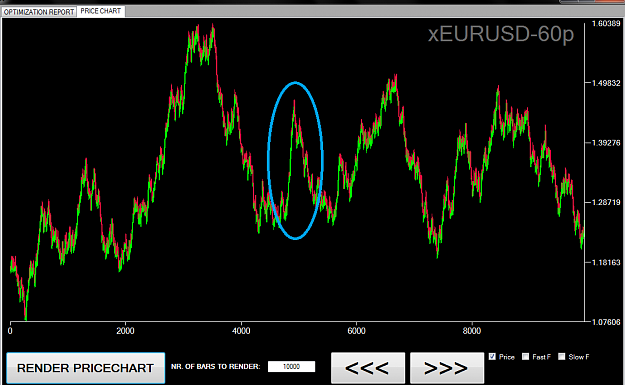
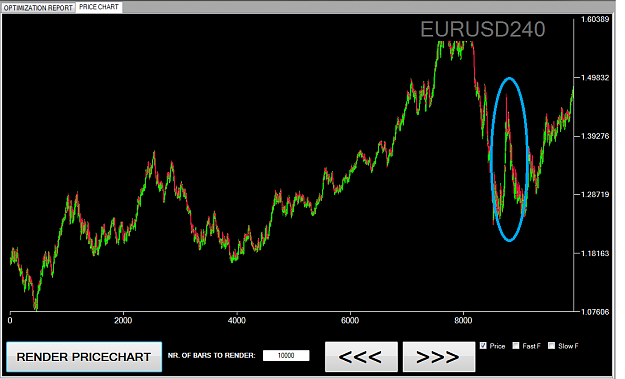
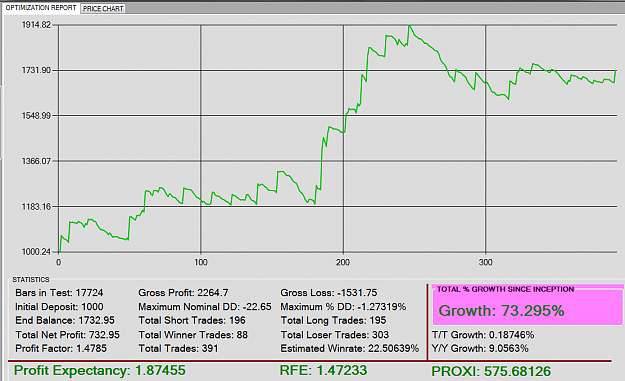
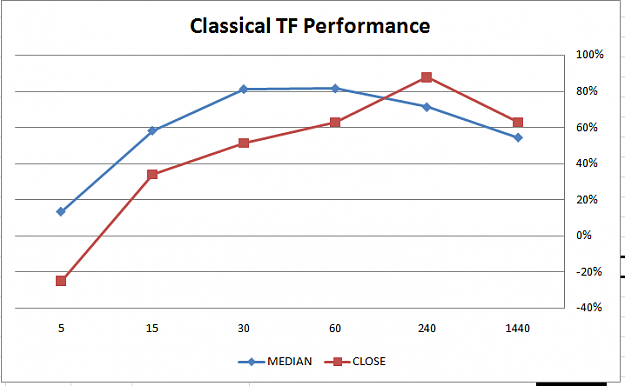
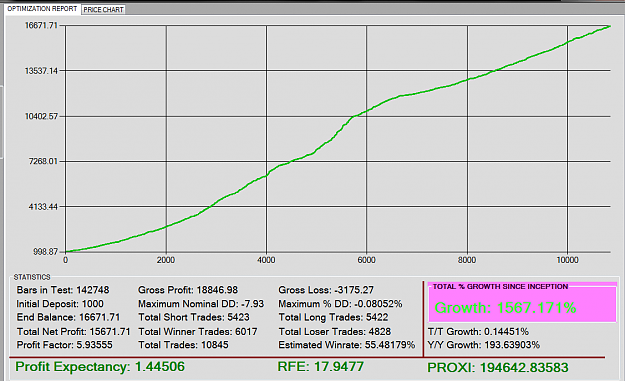
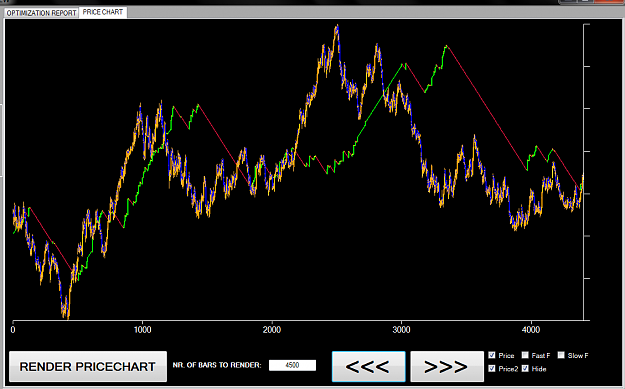
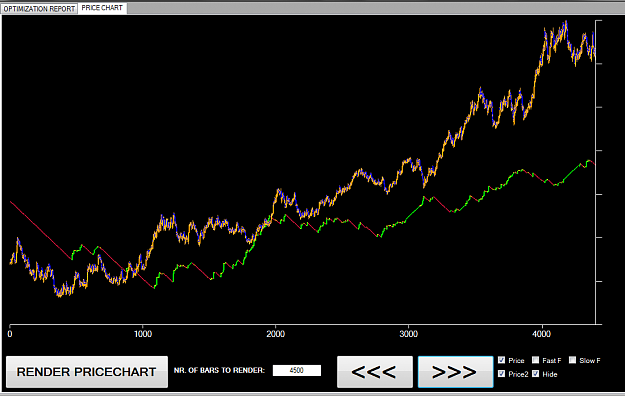
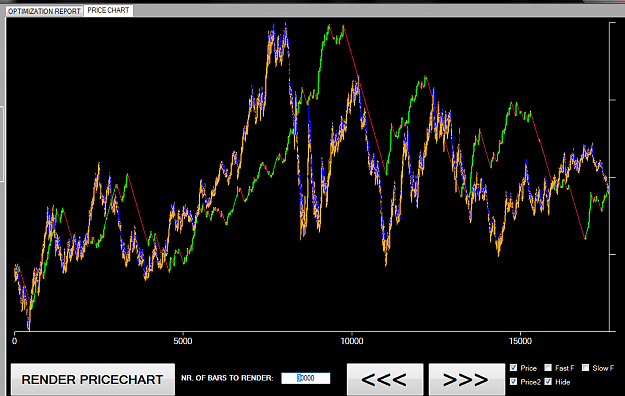
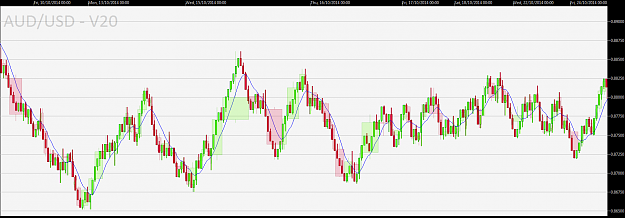
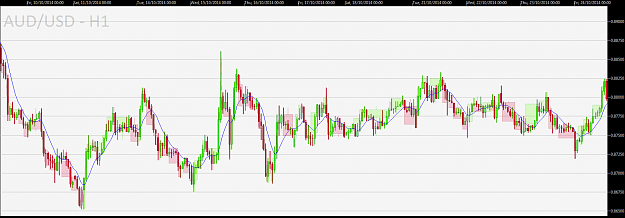
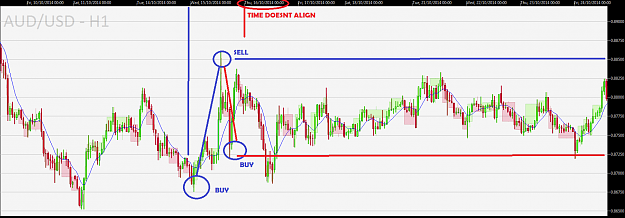
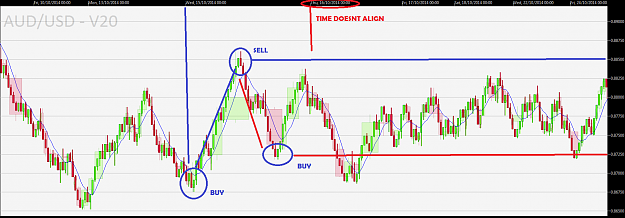
So yes, the 60 pip chart looks much smoother than the H4 chart (240 min), about 70% of the small fluctuating noise is removed without touching decreasing the accuracy much, so the TIME based chart is not that efficient.
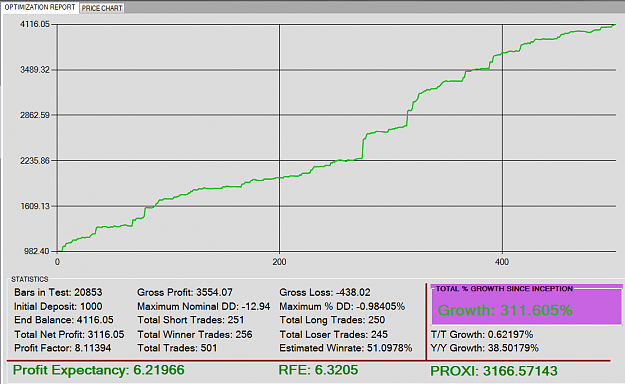
Although I would not jump to the tick chart as Adal suggested, because the tick chart contains much more noise than the H4 so, its would be really a stupid idea to do that, so i`ll just use PRICE TRANSFORMATIONS to filter out the noise, and leave the signals to my filters.
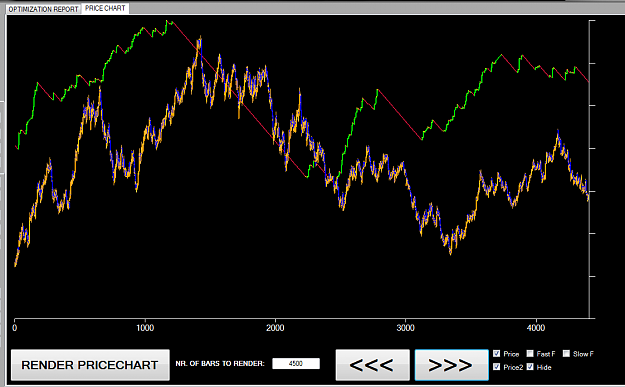
Adding 2-3 filters to filter them out would only cause more lagg and would not improve my performance, so I decided to transform the price itself, using various methods: Renko,CBR,Kagi,Log chart, etc and see if my results do improve or not.
Attached Image (click to enlarge)
Attached Image (click to enlarge)
So yes, the 60 pip chart looks much smoother than the H4 chart (240 min), about 70% of the small fluctuating noise is removed without touching decreasing the accuracy much, so the TIME based chart is not that efficient.
Although I would not jump to the tick chart as Adal suggested, because the tick chart contains much more noise than the H4 so, its would be really a stupid idea to do that, so i`ll just use PRICE TRANSFORMATIONS to filter out the noise, and leave the signals to my filters.
"There's a sucker born every minute" - P.T. Barnum