So anyway you guys, I'm pretty tired of working for "the man" and have said many times that I will some day find a way to trade profitably, consistently...or die trying. I have tried and tried and did not die, so now I'm back to trying again. If you all help me I will most certainly help you. Eurusdd was very generous in sharing his knowledge and maybe I can give something ankle-high to that.
Ignored
Look forward to it MetaC!
A pip is only worth it if you know how much you risked to earn it
{quote} I think I understand this - but what is the main trend? Or how does one (eg. a calculation) know which trend (ie. timeframe) has been chosen for the trade? Or is it better to take time out of the equation and use range bars?
Ignored
The main trend is whatever you want it to be - random numbers here... you can test a main trend of 7 mins 36 secs and a counter trend of 43 secs. If a 43 sec divergence has statistical validity against 00:07:36, you have a basis to begin. You can do the same with numbers of ticks. The smaller you go, the more you will be affected by time of day, and you will need to adjust parameters for that as well. So, for a given time window, you have, say, these 100 different time or tick (or something else) ratios that have proven statistically relevant. Now go through each ratio and optimize each for entry and exit. This will weed out at least 50% from the original set. Now you have expected return numbers. Next find your worst case scenarios, and you have risk. Obviously, none of this can be done by hand. You need to write testers first - and writing the tester is 100X harder than writing the trading EA, but it's not impossible.
Wow. What a nonsense I had to read within parts of the last three pages. Just go to the top of the page and open the link to the attachements made. There are enough PDFs to read and to get the info you need to make the next step of understanding some principles.
Also what more on information does anyone need when reading this post. http://www.forexfactory.com/showthread.php?p=7808484#post7808484 ...
Wow. What a nonsense I had to read within parts of the last three pages. Just go to the top of the page and open the link to the attachements made. There are enough PDFs to read and to get the info you need to make the next step of understanding some principles. Also what more on information does anyone need when reading this post. http://www.forexfactory.com/showthread.php?p=7808484#post7808484 ...
Ignored
Hey thanks for reading! Just a reminder that that was just a summary of one way to play the TZs. Cheers!
Sure my trading friend. I'am reading every post here. :-)
At the moment I'am on two fronts. At Page 448 catching up and also reading the current posts here. Thanks for all the posts you did cfd! Even when I don't post much I'am always here!
Hmmmm, looking at this again after a while, there appears to be an error in my calculation and statement. Sorry.
Let me go step by step and explain both the initial statement and the error I've made.
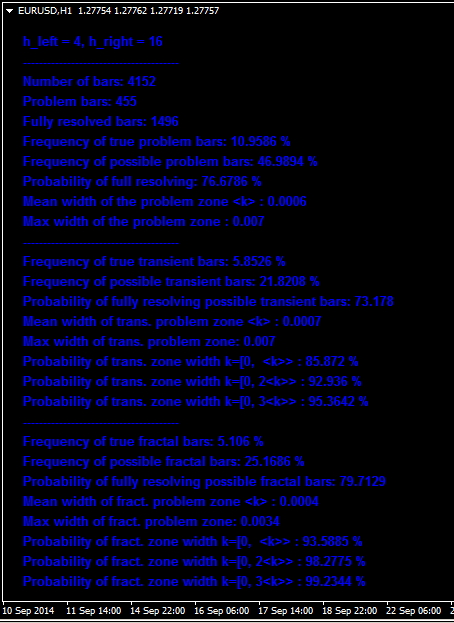
In your first post the clearance probability of the end-bar (fractal) zone within four bars away from it is 60.48%. That means that within fours bars from the zone's inception, historically in 60.48% of cases the price went through the zone, i.e. a transient zone has become recurrent.
In the situation after 16 hours, the probability has increased to 79.71%, so that means that within the 12 hours following the 4-hour period, additionally 79.71%-60.48%=19.23% of the total number of cases have cleared the zone, and that is the number (<20%) I have given in that post.
However, and this is what I did not take into account before, only 100%-60.48%=39.52% of the total number of cases have remained transient after 4 bars and this is supposed to be our starting point for a strategy. So the calculated 19.23% of the total number make slightly less than 50% (19.23/39.52=48.66%) of the remaining transient zones. Therefore the probability of clearance (within this quite long period of 12 bars) after one has observed that the h=4 zone wasn't cleared, is slightly less than 50%.
So the fractal zone indeed becomes repulsive (there is <50% of chance of clearing it within 12 hours after 4 hours after its inception have passed), but it not as repulsive as I stated previously. Also the R:R ratio needed should be better than 1:1. The probabilities will be improved by additional filters as described in the original post and I still think this is indeed quite tradable.
I hope the calculation is now clearer and I apologize for the error made previously.
Cheers,
k
{quote} Hmmmm, looking at this again after a while, there appears to be an error in my calculation and statement. Sorry. Let me go step by step and explain both the initial statement and the error I've made. In your first post the clearance probability of the end-bar (fractal) zone within four bars away from it is 60.48%. That means that within fours bars from the zone's inception, historically in 60.48% of cases the price went through the zone, i.e. a transient zone has become recurrent. In the situation after 16 hours, the probability...
Ignored
Stop speaking in math K my brain hurts Just joking. Thanks for your time and looking forward to V4!
I'm think that h_right and h_left may be a little confusing? Peeps may thinks h_right is referring to the right side of a PTZ or did I confuse myself again??
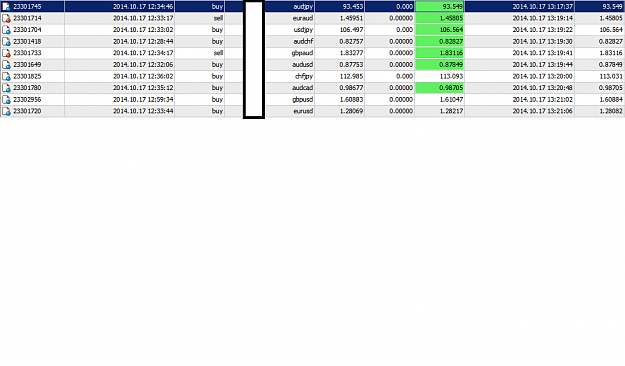
Tested today a scalper system purely based on m5 TZ’s. So far so good. 10 pairs, 10 trades, +/- 75 pips in 50 minutes.
@Hilavoku, answer you this weekend, was this week too busy with thinking about TZ’s, because they can be perfectly used to hedge CZ’s, I think. No conclusions yet.
Also thought about combining those two.
Time is running fast. Hopefully within the next five days I'am through with reading the thread (the first time). Then I'am focusing on open my mind to put the peaces together (with your help) ...
{quote} The main trend is whatever you want it to be - random numbers here... you can test a main trend of 7 mins 36 secs and a counter trend of 43 secs. If a 43 sec divergence has statistical validity against 00:07:36, you have a basis to begin. You can do the same with numbers of ticks. The smaller you go, the more you will be affected by time of day, and you will need to adjust parameters for that as well. So, for a given time window, you have, say, these 100 different time or tick (or something else) ratios that have proven statistically relevant....
Ignored
how would you avoid data mining issue in this approach? I am a quant trader and this is i do but you have to be very careful to avoid data mining issue. Once you tested 100s of combinations, then naturally some will come out better than others - just based on chances. the more combinations you test, the lower the confidence that the best performing combination will have any real edge in the trading.
{quote} Stop speaking in math K my brain hurts Just joking. Thanks for your time and looking forward to V4! I'm think that h_right and h_left may be a little confusing? Peeps may thinks h_right is referring to the right side of a PTZ or did I confuse myself again??
Ignored
Well, it obviously managed to confuse me as well, so no surprise.
To repeat, h_left is the h value on the left hand side and h_right is the h value on the right hand side of the transient zone.
The idea is to give a more general values of probability vs time. If one keeps h_left = h_right, then one is left with the conventional situation for h.
k
{quote} Hi, the "true" transient bar is the one where the price has not revisited (edit: better to say, the price has not pushed through the zone) the mid-bar zone within h_right. The true fractal bar is where the price has not returned to clearing the end-bar zone. I'll put out a document which should clarify things, together with a new version soon. k
you are just LAZY AND IGNORANT. (this does not apply to those who have English as a second language).
Ignored
omg, why ff. is not in French?
i still have difficulties to understand. I am here from the beginning of the thread, read all thread of eurusd, And much more...realy much more. I must read 3 or 4 Times to be sûre to understand every word i read.
but i dont give up, i am sometimes frustrated, sometimes disapointed, sometimes i hope, but i Will never give up. I Will never give up till i found something. I am sûre i Will found something in this thread That unlight my trading. I am an optimist by nature
And i thank you all for sharing all this wonderfull thread (but not thanks to my ancestrals cause French is not the international langage )
Bottomless wonders spring from simple rules, which are repeated without end
Tested today a scalper system purely based on m5 TZ’s. So far so good. 10 pairs, 10 trades, +/- 75 pips in 50 minutes. @Hilavoku, answer you this weekend, was this week too busy with thinking about TZ’s, because they can be perfectly used to hedge CZ’s, I think. No conclusions yet. {image}
{quote} omg, why ff. is not in French? i still have difficulties to understand. I am here from the beginning of the thread, read all thread of eurusd, And much more...realy much more. I must read 3 or 4 Times to be sûre to understand every word i read. but i dont give up, i am sometimes frustrated, sometimes disapointed, sometimes i hope, but i Will never give up. I Will never give up till i found something. I am sûre i Will found something in this thread That unlight my trading. I am an optimist by nature And i thank you all for sharing all...
Ignored
YOU HAVE THE RIGHT ATTITUDE *** TIP**** Go to post 8085 & 8086 and just look at the charts posted, this is the best place to get understanding of the core principle.
{quote} how would you avoid data mining issue in this approach? I am a quant trader and this is i do but you have to be very careful to avoid data mining issue. Once you tested 100s of combinations, then naturally some will come out better than others - just based on chances. the more combinations you test, the lower the confidence that the best performing combination will have any real edge in the trading.
Ignored
I use different sized data sets. The smallest set of data from now back X fits my intended trade window, and is filtered for best result - essentially the Markov assumption, courtesy of EURUSDD. Results for longest set of data should yield roughly the same validity (or lack thereof). So, running the small data set tells what is valid now. That said, this type of tweaking should only be necessary on very small time or tick frames. For MT4 and the retail environment, parameters can be good for days and sometimes weeks.
Cycle identifier attached, this is the first time I've uploaded a file, hope it works. {file} {file}
Ignored
The cycle-identifer indicator from Page 1 of the Thread looks great. Seems to me that if you buy on the MajorCycleBuy signals and sell on the MajorCycleSell signals, further confirming that the most recent different-timeframe stochastic mismatch occurred above your buys or below your sells, you will have very high probability trades.
For trade closure, you could use the next MajorSellCycle signal to close your buys, and vice versa.
IF, of course, the indicator draws these signals in a timely fashion. I mean, it doesn't ONLY look good in retrospect, does it?
Does anyone have experience incorporating an indicator like cycle-identifier into their EA's code, so that they can programmatically look at the signals it gives? I will eventually figure it out myself but would be happy to get help.
{quote} The cycle-identifer indicator from Page 1 of the Thread looks great. Seems to me that if you buy on the MajorCycleBuy signals and sell on the MajorCycleSell signals, further confirming that the most recent different-timeframe stochastic mismatch occurred above your buys or below your sells, you will have very high probability trades. For trade closure, you could use the next MajorSellCycle signal to close your buys, and vice versa. IF, of course, the indicator draws these signals in a timely fashion. I mean, it doesn't ONLY look good in retrospect, does it? Does anyone have experience incorporating an indicator like cycle-identifier into their EA's code, so that they can programmatically look at the signals it gives? I will eventually figure it out myself but would be happy to get help.