have you ever think about correlation to use it for finding exact strength behind the currency pairs. hukam
//------
hey hukam...... have i ever...... just about everyday...... how were your figuring on determining the correlation and/or strength.....
some things i have tried......
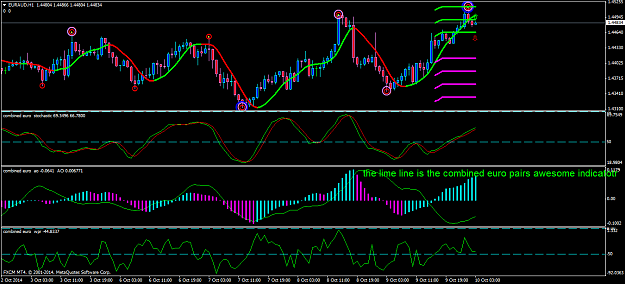
summing the values for per indicator or signal per currency..... such as, summing the awesome indicator value for each of the euro pairs, then plotting it.... the euraud chart below has the eur 'combined stoch, awesome, and wpr on the chart.... the euraud's awesome is histogram and the combined eur awesome is the lime line....
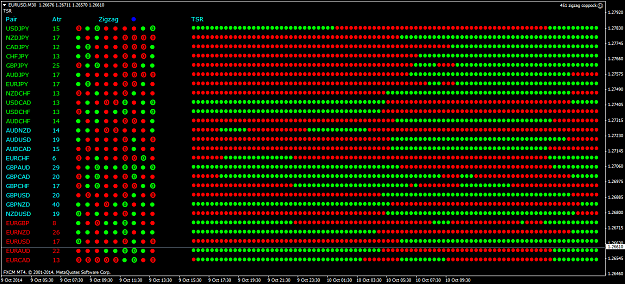
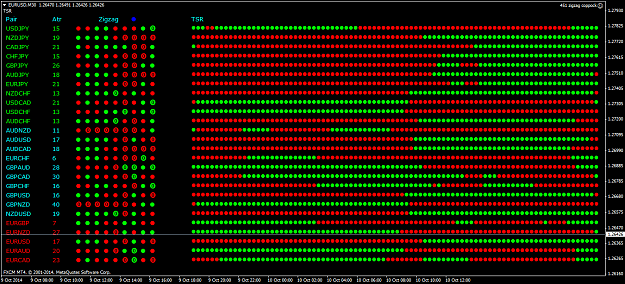
then i would sort each by value, such as very poorly seen here....... talk about a crappy video... ...... what you can't see is the pairs are being sorted by strength on 5 timeframes..... it helps to color code the currencys....
//----
sorting by a single indicator on a single timeframe, such as relative strength, has not been helpful to me......
i've done this for virtually indicator or signal.... this includes obscure indicators like td sequential.....
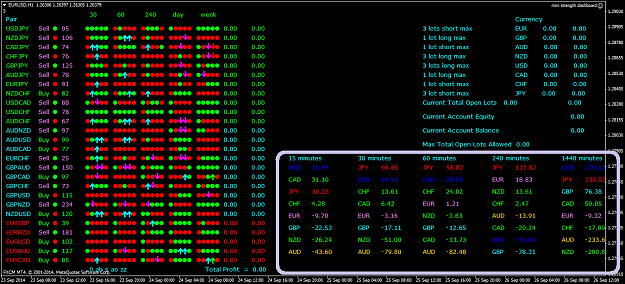
have also summed every signal per pair and per currency to get an idea of the number of signals per timeframe..... along with maximum and minimum price excursions during the signals life...... here you would sort inversely to determine strength....
//------
if you , or anyone else, has an idea or method just holler and we can try it out..... worst we can do is lose money.....h
//-----
//------
hey hukam...... have i ever...... just about everyday...... how were your figuring on determining the correlation and/or strength.....
some things i have tried......
summing the values for per indicator or signal per currency..... such as, summing the awesome indicator value for each of the euro pairs, then plotting it.... the euraud chart below has the eur 'combined stoch, awesome, and wpr on the chart.... the euraud's awesome is histogram and the combined eur awesome is the lime line....
then i would sort each by value, such as very poorly seen here....... talk about a crappy video...
//----
sorting by a single indicator on a single timeframe, such as relative strength, has not been helpful to me......
i've done this for virtually indicator or signal.... this includes obscure indicators like td sequential.....
have also summed every signal per pair and per currency to get an idea of the number of signals per timeframe..... along with maximum and minimum price excursions during the signals life...... here you would sort inversely to determine strength....
//------
if you , or anyone else, has an idea or method just holler and we can try it out..... worst we can do is lose money.....h
//-----
Attached Image (click to enlarge)
to trade and code, keep both simple... no call to impress....h