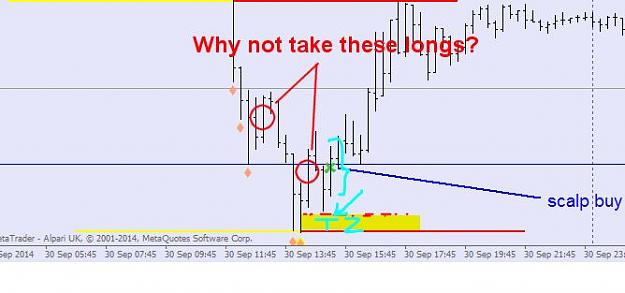
DislikedThis is for the questions I'm getting asked via PM regarding Uneven Transient Zones (UTZ) The chart is 5M. My platform is IGIndex so there are no MT4 indicators, just visual. The anchoring bar that produces the HIGH or LOW is the central bar. Take the HI and LO of this bar H is any number of bars before and after this central bar. For this example, I'll use 8 (no reason, random number) Take the lowest LO of any bar within H range of the central bar. Draw a mental red line. The highlighted section is the difference between the Red Line and the Low...Ignored
Regards orid peter