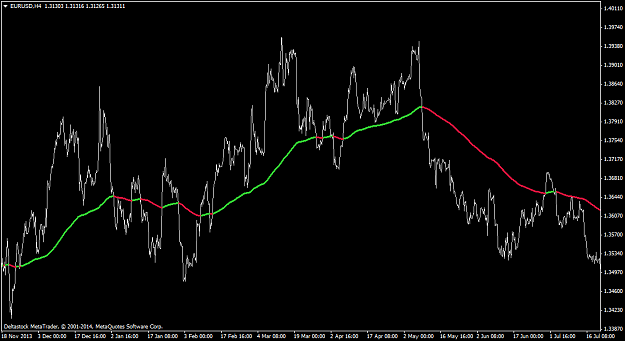
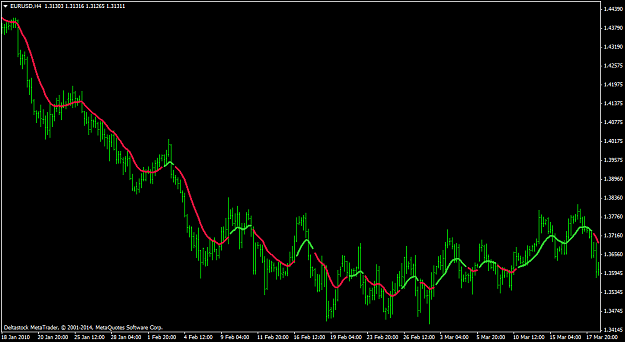
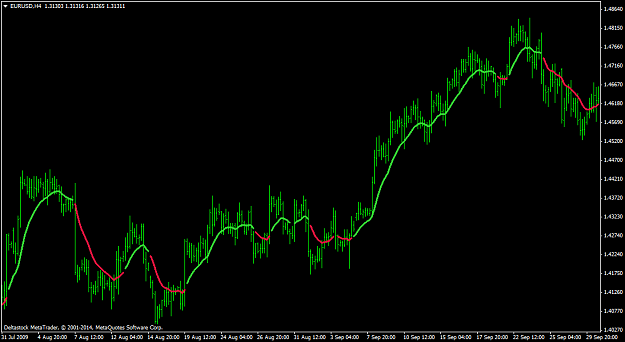
Disliked{quote} Really? The moving averages (filters) in the first two pictures are clearly drawn by hand in Paint. You can see the pixels overlap, or the missing pixels where you weren't careful enough. But if you insist that they are real, congrats, you'll be a billionaire very very soon. Just buy when the price is 15 pips below the average and sell when it's 15 pips above.Ignored
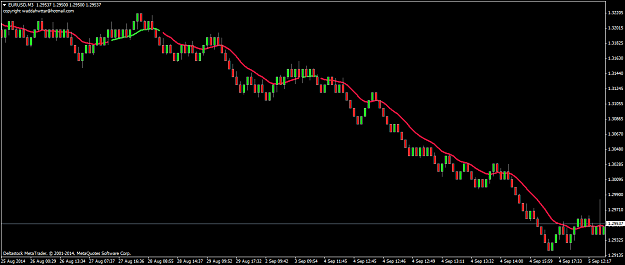
You should see my prev posts where i drawn stuff in paint, you can see that i dont have the talent to draw this nice.It's not drawn in paint, it is a real indicator, and also it does not repaint and laggs only 1 bar in the slope form, in its real form it has 0 bar lagg.
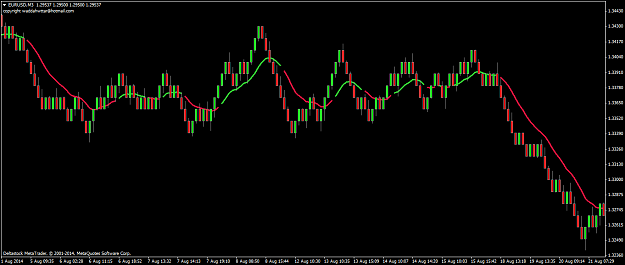
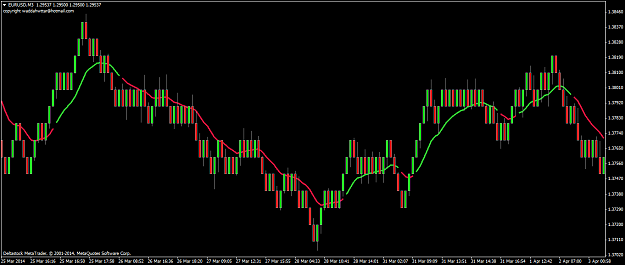
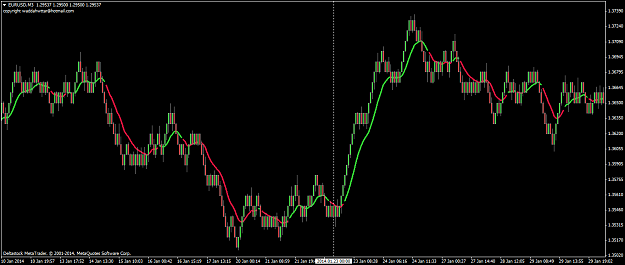
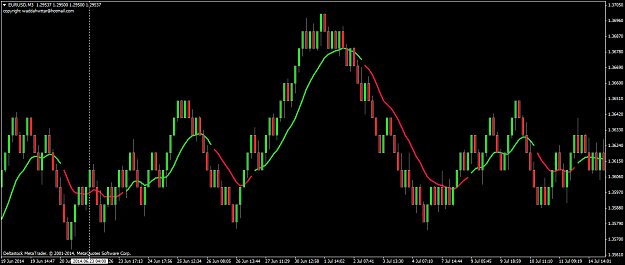
Anyway it looks that way because is has a width of 5, here i reduced the width so you can see it better.
Attached Image (click to enlarge)
Attached Image (click to enlarge)
Attached Image (click to enlarge)
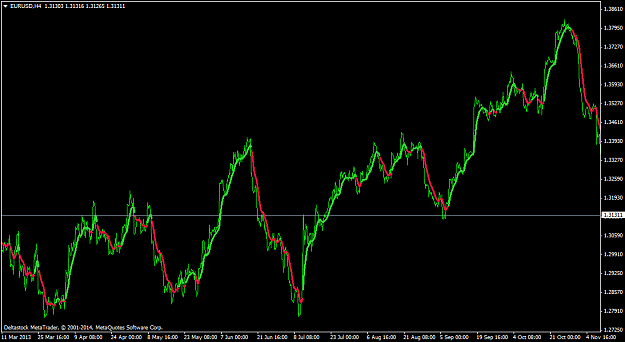
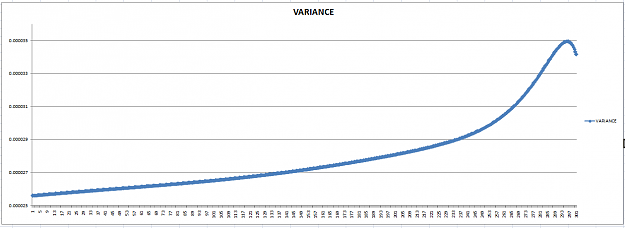
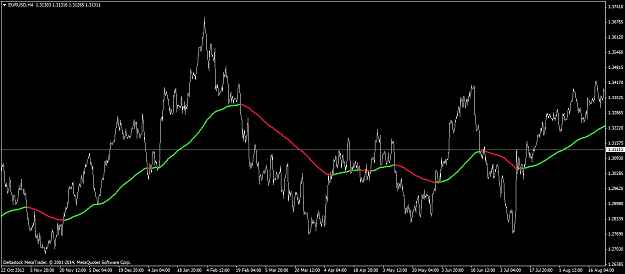
It has a gap of 1 bar between the color change because it laggs 1 bar, so this slope MA is not the true, MA which is used its only a derivative of it so it laggs 1 bar, but the real indicator i wont show.Anyway its only for education purpose, i try to figure out the mean reversion precisely
"There's a sucker born every minute" - P.T. Barnum