• Home
  • Forums
  • Trades
  • News
  • Calendar
  • Market
  • Brokers
  • Login
  • Join
  • User/Email: Password:
  • 4:02am
Menu
  • Forums
  • Trades
  • News
  • Calendar
  • Market
  • Brokers
  • Login
  • Join
  • 4:02am
Sister Sites
  • Metals Mine
  • Energy EXCH
  • Crypto Craft

Options

Bookmark Thread

First Page First Unread Last Page Last Post

Print Thread

Similar Threads

4 Hour Strategy Macd+other Indicator 21 replies

average true range for 1 hour and 4 hour charts 2 replies

X-1102 1 hour , 4 hour and daily Tf trades 7 replies

Create a verticle line at certain hour for every certain hour 16 replies

Is the "4 Hour Strategy (MACD)" the best system here at FF? 20 replies

  • Commercial Content
  • /
  • Reply to Thread
  • Subscribe
  • 12,921
Attachments: 4 Hour Strategy (MACD)
Exit Attachments

4 Hour Strategy (MACD)

  • Last Post
  •  
  • 1 14131414Page 141514161417 1578
  • 1 Page 1415 1578
  •  
  • Post #28,281
  • Quote
  • Edited at 3:13am Aug 27, 2014 2:41am | Edited at 3:13am
  •  yaakruay
  • | Joined Feb 2013 | Status: Member | 482 Posts
Quoting trademin
Disliked
{quote} Hi Nic, sorry I cannot help you on that one. I use only the 4 hrs strategy including the figures(RT, RB, SHS,etc.)- I have never quite understood the idea on the elliot waves.
Ignored

Anymore screen shots of your trades analysis with explanation.

There must be sHs coming soon as most currencies bombed last month, so profit taking this week and a correction or reverse coming soon.

Any charts?

thanking you.

ps..just changed my computer and busy swapping things over..i have mt4 but just the basics no h4 systems macd indicator installed etc..

There you go another install needed Jing....

i hate swapping computers... (love new computers just hate the swap over)
 
 
  • Post #28,282
  • Quote
  • Aug 27, 2014 8:35am Aug 27, 2014 8:35am
  •  trademin
  • | Joined Apr 2007 | Status: Member | 910 Posts
Quoting yaakruay
Disliked
{quote} Anymore screen shots of your trades analysis with explanation. There must be sHs coming soon as most currencies bombed last month, so profit taking this week and a correction or reverse coming soon. Any charts? thanking you. ps..just changed my computer and busy swapping things over..i have mt4 but just the basics no h4 systems macd indicator installed etc.. There you go another install needed Jing.... i hate swapping computers... (love new computers just hate the swap over)
Ignored
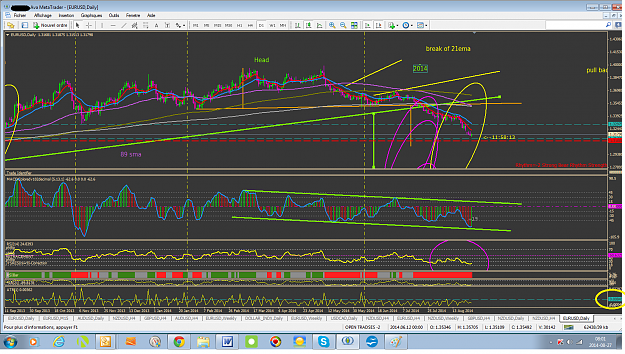
Hi yaakruay , there is my view on the pair, but don’t forget I could be totally wrong!

EURUSD :
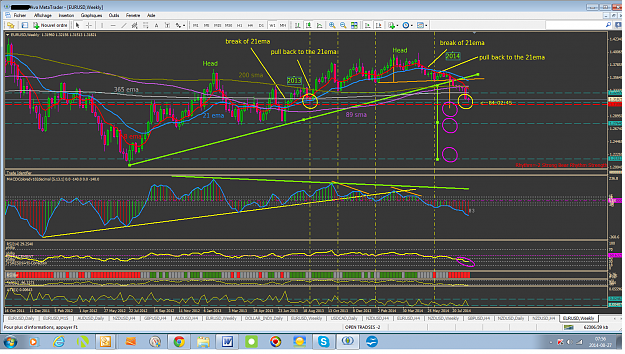
I’ll start with the weekly chart:
As mentioned before there were some HS that their projected targets have been hit but now there is this last HS and the possible target as per the projection is almost reached: 1.3100
Yellow circle: that is a target that the pair just sit on it now.
What is amazing here is the “easy” break of the 365! The pair didn’t pay attention to it! Just went right through! Just like a knife in warm butter expressed by a 200 pips+ candle!
Notice here that the 365 is flat, and in the past the pair was above it. But when it is flat there is a possibility of a consolidation and price could go both side of it and that last strong bar is the first to cross down the 365. Do I expect that pair to go lower? Yes I do!

No big news today for the EURUSD, but tomorrow, red news could move the pair with noticeable action. Since a level has been reach I am not expecting a lot of movement today since fundamentally Russia /Ukraine look for a cooling off(as I heard of)

On the daily chart:
ATR is about 85 pips as possible range for the day…35 pips have been done already and a move to the 8 ema (in red) would cover about 85 pips. Could the pair move back to 1.3224(the 8 ema)? I have to say that the macd is oversold so it could be on the card!
So maybe for today a start of a consolidation is possible.

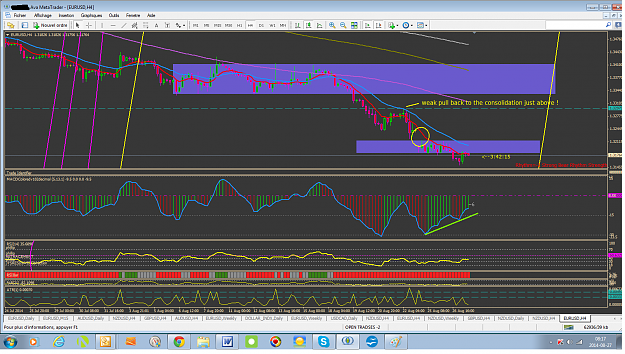
On the 4hrs chart:
ATR is about 33 pips range just enough to fill back the small consolidation by reaching the 21ema (in blue) if the pair is strong enough to do that! But there Is also a gap to be filled will it be this week?- there is a double bottom in the macd and a positive divergence…
But over all, I am still bearish on the pair while there is maybe a pause in sight
Attached Images (click to enlarge)
Click to Enlarge

Name: 140827EURUSD WEEKLY.png
Size: 147 KB Click to Enlarge

Name: 140827EURUSD DAILY.png
Size: 147 KB Click to Enlarge

Name: 140827EURUSD-4hrs.png
Size: 117 KB
Attached Files
File Type: ex4 4h_MACD_FX_Strategy.ex4   5 KB | 396 downloads
File Type: mq4 4h_MACD_FX_Strategy.mq4   5 KB | 444 downloads
File Type: ex4 MACDColoredv102decimal.ex4   7 KB | 451 downloads
Yvon
 
 
  • Post #28,283
  • Quote
  • Aug 27, 2014 3:04pm Aug 27, 2014 3:04pm
  •  yaakruay
  • | Joined Feb 2013 | Status: Member | 482 Posts
Quoting trademin
Disliked
{quote} Hi yaakruay , there is my view on the pair, but don’t forget I could be totally wrong! EURUSD : I’ll start with the weekly chart: As mentioned before there were some HS that their projected targets have been hit but now there is this last HS and the possible target as per the projection is almost reached: 1.3100 Yellow circle: that is a target that the pair just sit on it now. What is amazing here is the “easy” break of the 365! The pair didn’t pay attention to it! Just went right through! Just like a knife in warm butter expressed by...
Ignored

Brilliant thank you.....

The ATR. Another thing to learn....
 
 
  • Post #28,284
  • Quote
  • Aug 27, 2014 3:19pm Aug 27, 2014 3:19pm
  •  trademin
  • | Joined Apr 2007 | Status: Member | 910 Posts
Quoting yaakruay
Disliked
{quote} Brilliant thank you..... The ATR. Another thing to learn....
Ignored
you are welcome yaakruay
thanks for the comment.
you just have to set ATR at 1 then you just need to draw an horizontal line that touches the peaks and there you are!you just have the average range done by candles!
Yvon
 
 
  • Post #28,285
  • Quote
  • Aug 27, 2014 5:12pm Aug 27, 2014 5:12pm
  •  yaakruay
  • | Joined Feb 2013 | Status: Member | 482 Posts
Quoting trademin
Disliked
{quote} you are welcome yaakruay thanks for the comment. you just have to set ATR at 1 then you just need to draw an horizontal line that touches the peaks and there you are!you just have the average range done by candles!
Ignored

Can i pick your brains, what does your brain compute when your eyes browse over the ATR..

I know you are very descriptive when explaining ideas and my brain learns quickly like that...

That's the reason i ask so i can use your picture that you paint.

thanks
Richard.
 
 
  • Post #28,286
  • Quote
  • Aug 28, 2014 3:09am Aug 28, 2014 3:09am
  •  yaakruay
  • | Joined Feb 2013 | Status: Member | 482 Posts
Bringing everything together from JP and Trademin (sorry except your expert knowledge on sHs)

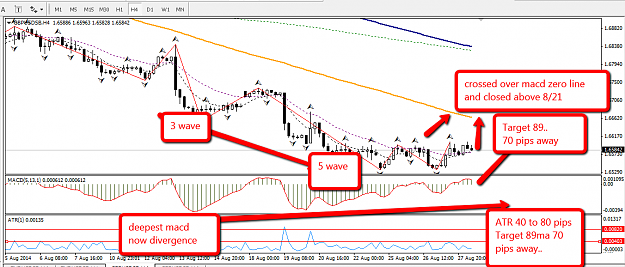
Wave 5 down and finished..search for a.b.c on lower time frames m30..h1
(edit i can see a.b.c on the h4 chart and the 89 would make a beautiful area for the c)

This can mean after wave 3 (deepest) divergence has started.

Close above 8/21

Target 89.

ATR showing two targets 40 and 80 pips.

The 89 is about 70-80 pips away so this is doable in a days range.

double edit.

could this be the 2nd shoulder of an inverted sHs. if so a break of the neckline would take us nicely to the 89 too.


The target could be hit.

I have a buy order open but i don't have the charts on the pc i am using..lets wait and see..

thanks to all the contributors..i learn so much...losing is so much slower these days.. hahaha​
Attached Image (click to enlarge)
Click to Enlarge

Name: 2014-08-28_0800.png
Size: 71 KB
 
 
  • Post #28,287
  • Quote
  • Aug 28, 2014 8:16am Aug 28, 2014 8:16am
  •  nic73
  • | Joined Feb 2013 | Status: Member | 439 Posts
Don't know about you guys but this seem to be a no-trade week for me. The pairs I am trading have no direction. Traded AUDNZD and GBPUSD and either took very small profit or closed out at BE. Not complaining but want to hear from other trader how you have done this week?

How does one apply ATR? Yvon mentioned to me he uses this but not sure how it actually works. Can someone enlighten me?

Nicholas
 
 
  • Post #28,288
  • Quote
  • Aug 28, 2014 9:08am Aug 28, 2014 9:08am
  •  trademin
  • | Joined Apr 2007 | Status: Member | 910 Posts
Quoting yaakruay
Disliked
{quote} Can i pick your brains, what does your brain compute when your eyes browse over the ATR.. I know you are very descriptive when explaining ideas and my brain learns quickly like that... That's the reason i ask so i can use your picture that you paint. thanks Richard.
Ignored

hi yaakruay,
"brain computing"...
About the ATR, It is just a matter of range. In a blink of an eye I know the range a candle could do before it closes.
Since trading is based on anticipation, knowing what range a candle could do, helps “anticipate” what could happens: where should I put the initial SL if confuse about its position, or if the target is at reachable level, or if ATR has periodic spikes, should I anticipate one coming soon? Will it affect my trade? etc...
just as example:
it is Friday morning, the weekly ATR show an average of 200 pips range but the last candle shows a range of 180 pips done already, sure a candle could do more than 200 pips, but a 20 possible pips doesn't inspire me for a trade that has 70 pips target!-I am certainly not expecting a lot of action for the day.
Yvon
 
 
  • Post #28,289
  • Quote
  • Aug 28, 2014 6:58pm Aug 28, 2014 6:58pm
  •  ens0uled
  • | Joined Jun 2013 | Status: Member | 10 Posts
Trademin can you tell me where to get The RSI-Bar?
regards
 
 
  • Post #28,290
  • Quote
  • Aug 28, 2014 10:26pm Aug 28, 2014 10:26pm
  •  trademin
  • | Joined Apr 2007 | Status: Member | 910 Posts
Quoting ens0uled
Disliked
Trademin can you tell me where to get The RSI-Bar? regards
Ignored

hi ens0uled,

there it is:
Attached Files
File Type: ex4 RSIBar (1) - Copie.ex4   3 KB | 252 downloads
File Type: mq4 RSIBar (1) - Copie.mq4   2 KB | 279 downloads
Yvon
 
 
  • Post #28,291
  • Quote
  • Aug 29, 2014 8:03am Aug 29, 2014 8:03am
  •  nic73
  • | Joined Feb 2013 | Status: Member | 439 Posts
Quoting yaakruay
Disliked
Bringing everything together from JP and Trademin (sorry except your expert knowledge on sHs) Wave 5 down and finished..search for a.b.c on lower time frames m30..h1 (edit i can see a.b.c on the h4 chart and the 89 would make a beautiful area for the c) This can mean after wave 3 (deepest) divergence has started. Close above 8/21 Target 89. ATR showing two targets 40 and 80 pips. The 89 is about 70-80 pips away so this is doable in a days range. double edit. could this be the 2nd shoulder of an inverted sHs. if so a break of the neckline would take...
Ignored
Hi Richard,

You are using ATR to determine target price? Can you tell me how ATR is applied. And the set up in the chart? Please. Thanks.
 
 
  • Post #28,292
  • Quote
  • Aug 29, 2014 9:45am Aug 29, 2014 9:45am
  •  trademin
  • | Joined Apr 2007 | Status: Member | 910 Posts
Quoting nic73
Disliked
Don't know about you guys but this seem to be a no-trade week for me. The pairs I am trading have no direction. Traded AUDNZD and GBPUSD and either took very small profit or closed out at BE. Not complaining but want to hear from other trader how you have done this week? How does one apply ATR? Yvon mentioned to me he uses this but not sure how it actually works. Can someone enlighten me? Nicholas
Ignored
Nic,
This is an appropriate statement about pairs having no direction or seems to have no direction. I agree with you on that.

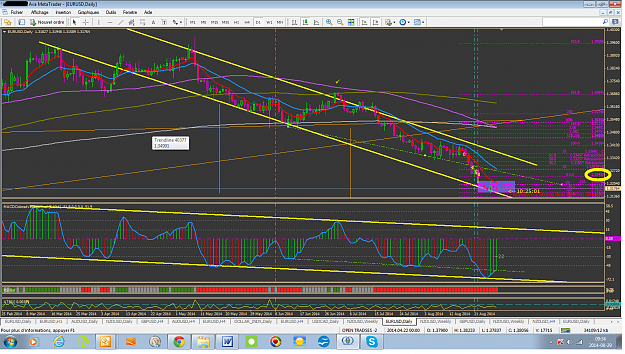
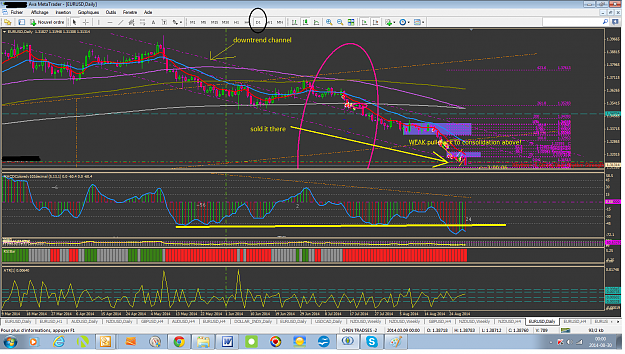
Just look at the (daily) EURUSD pair: the pair just reached the lower trend of the down trend channel and seems to start a correction up. Well! where are the sellers? They are maybe looking for a sell at higher level…
While at the USD index: it just reached a possible target. Will it break, will it turn away down? If it turns away down, I wouldn't be surprised to see the gap in EURUSD being filled with appetite.
Attached Image (click to enlarge)
Click to Enlarge

Name: 14029EURUSD daily.png
Size: 133 KB
Yvon
 
 
  • Post #28,293
  • Quote
  • Aug 29, 2014 1:46pm Aug 29, 2014 1:46pm
  •  yaakruay
  • | Joined Feb 2013 | Status: Member | 482 Posts
Quoting nic73
Disliked
{quote} Hi Richard, You are using ATR to determine target price? Can you tell me how ATR is applied. And the set up in the chart? Please. Thanks.
Ignored
Not really, i was just practicing using the ATR after Trademin put me onto it, in his previous posts.

I was just trying to make the analysis simple by using each instrument we talk about on this thread.

It appears complicated is what people want..

I don't, i want it simple..

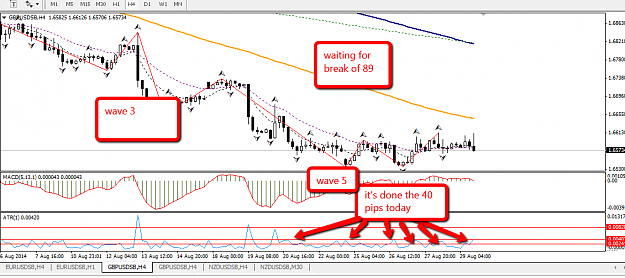
If the ATR has some peaks about 40 or 80 pips high and then it has only moved 10 pips, is there a spike due to take the range upto 40 - 80 pips...this was on the Us/Gb I am talking about.

So the price has made the average 40 pip range already on Friday, so i will not trade it.

There could be a spike coming but i am happy to wait till next week to find out.

I hope this is what Trademin is teaching us....in a nutshell.

If the daily range has been hit...what else can happen...a spike or back to consolidation. So I am not interested in trading the U/GBP as the daily range has been hit...only a spike that i cannot for see could take price higher/lower..
Attached Image (click to enlarge)
Click to Enlarge

Name: 2014-08-28_0800.png
Size: 58 KB
 
 
  • Post #28,294
  • Quote
  • Aug 29, 2014 11:50pm Aug 29, 2014 11:50pm
  •  trademin
  • | Joined Apr 2007 | Status: Member | 910 Posts
"If the daily range has been hit...what else can happen...a spike or back to consolidation. So I am not interested in trading the U/GBP as the daily range has been hit...only a spike that i cannot for see could take price higher/lower.."


exactly!
Yvon
 
 
  • Post #28,295
  • Quote
  • Aug 30, 2014 12:13am Aug 30, 2014 12:13am
  •  trademin
  • | Joined Apr 2007 | Status: Member | 910 Posts
Amazing pair the EURUSD is!
The price broke the down trend channel heading to the next target…amazing!
Amazingly I sold it again…right at the break of the downtrend line. Late but I sold it!
Free ride now will see! Targets are getting lower and lower!
Attached Image (click to enlarge)
Click to Enlarge

Name: 14029EURUSD daily-2.png
Size: 138 KB
Yvon
 
 
  • Post #28,296
  • Quote
  • Edited Sep 1, 2014 8:32am Aug 31, 2014 6:19pm | Edited Sep 1, 2014 8:32am
  •  trademin
  • | Joined Apr 2007 | Status: Member | 910 Posts
Quoting trademin
Disliked
Amazing pair the EURUSD is! The price broke the down trend channel heading to the next target…amazing! Amazingly I sold it again…right at the break of the downtrend line. Late but I sold it! Free ride now will see! Targets are getting lower and lower! {image}
Ignored

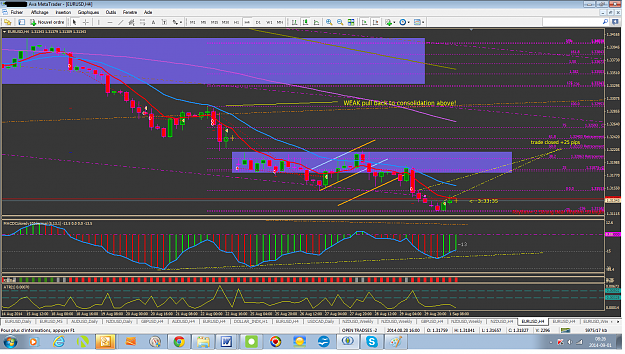
EURUSD: 17 pips secured. now 25 pips secured.

trade closed +25 pips
Attached Image (click to enlarge)
Click to Enlarge

Name: 140829EURUSD.png
Size: 126 KB
Yvon
 
 
  • Post #28,297
  • Quote
  • Aug 31, 2014 7:05pm Aug 31, 2014 7:05pm
  •  ens0uled
  • | Joined Jun 2013 | Status: Member | 10 Posts
Thank you Trademin, can you tell me how to use the ATR 1 and the RSI 14 (?) in combination with the MACD?
Or if someone has already asked this question and you answered it, can you give me the Number of the Post?

regards & a good week for all of you
 
 
  • Post #28,298
  • Quote
  • Edited at 8:33am Sep 1, 2014 12:27am | Edited at 8:33am
  •  trademin
  • | Joined Apr 2007 | Status: Member | 910 Posts
Quoting ens0uled
Disliked
Thank you Trademin, can you tell me how to use the ATR 1 and the RSI 14 (?) in combination with the MACD? Or if someone has already asked this question and you answered it, can you give me the Number of the Post? regards & a good week for all of you
Ignored


hi ens0uled,

ATR:I think post 28288 explains it as well as post 28293. It doesn’t need to be used with other indicator. I know That I have written about it in the past , but don’t remember the posts numbers, sorry about That!

Let say that ATR and RSI are from Welles Wilder which he explained in his book: “new concepts in technical trading systems”(in 1978)what they are about, it is very interesting btw. ATR means (simplified version!)that you take the high , you add the low then you divide it by two and you get the average! This is the result for 1 candle.
As for the RSI it just brings a new dimension to a chart. Many aspects as shown in his book, but you can have them on internet in order to get familiarize with it. After being familiarize you will be able to apply the right aspect for the moment you see on the chart.

But don’t forget they are just “tools”. Philip Nel doesn’t even use the macd in some of his videos!
What is important is to master the rhythm of the market first. You need to see the rhythm and “anticipate” what should be coming next. The indicators would only confirm what you have seen already on the chart in a different way.
You need to see the waves/bounces the candles are making on the 21 ema. I have the RSI on my chart because Phillip Nel talked about retracement and correction, but it is far in my mind now, but again I do not need it. It is there on my chart, but I don’t read it.

Now I see a figure formation: it is a RT so I should sell it! This is just the beginning! What you need to see is to see in advance what should be coming up! Same with RB or HS! At the beginning you don’t see them before it is done! Then with time you will start to see them, then, later you will be able to read them!

Phillip Nel shows RT,RB, etc on the pdf on page one on This tread. Then a bit later he shows them but they are not completed, so you can start seeing them while they are “under construction.” So you can “know” that there is a formation coming and each coming candle should fall into place to represent the formation and There you are! Ready to pull the trigger at the right moment!
This is what I whish for every trader, including me!
Yvon
 
 
  • Post #28,299
  • Quote
  • Sep 1, 2014 2:35am Sep 1, 2014 2:35am
  •  yaakruay
  • | Joined Feb 2013 | Status: Member | 482 Posts
Quoting trademin
Disliked
{quote} 28293 hi ens0uled, ATR:I think post 28288 explains it as well as post 28293. It doesn’t need to be used with other indicator. I know That I have written about it in the past , but don’t remember the posts numbers, sorry about That! Let say that ATR and RSI are from Welles Wilder which he explained in his book: “new concepts in technical trading systems”(in 1978)what they are about, it is very interesting btw. ATR means (simplified version!)that you take the high , you add the low then you divide it by two and you get the average! This is...
Ignored


This.....

(now if i can just action that...walk the walk and not just talk the talk)
 
 
  • Post #28,300
  • Quote
  • Sep 1, 2014 4:10am Sep 1, 2014 4:10am
  •  greenwich
  • | Joined Aug 2014 | Status: Junior Member | 1 Post
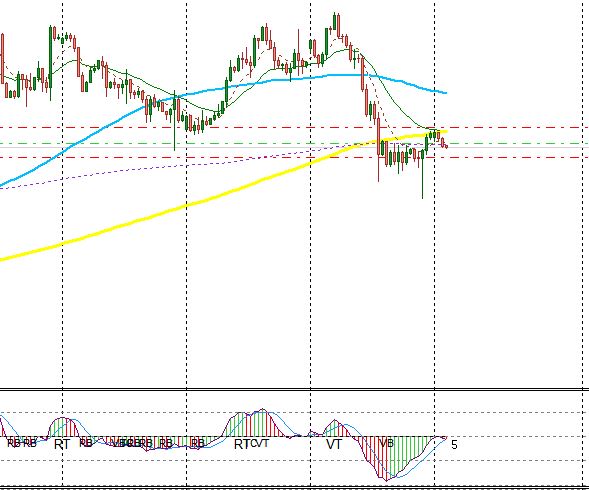
The signal of TC short seemingly USDCAD on H4MACD.
Attached Image
 
 
  • Commercial Content
  • /
  • 4 Hour Strategy (MACD)
  • Reply to Thread
    • 1 14131414Page 141514161417 1578
    • 1 Page 1415 1578
2 traders viewing now
  • More
Top of Page
  • Facebook
  • Twitter
About FF
  • Mission
  • Products
  • User Guide
  • Media Kit
  • Blog
  • Contact
FF Products
  • Forums
  • Trades
  • Calendar
  • News
  • Market
  • Brokers
  • Trade Explorer
FF Website
  • Homepage
  • Search
  • Members
  • Report a Bug
Follow FF
  • Facebook
  • Twitter

FF Sister Sites:

  • Metals Mine
  • Energy EXCH
  • Crypto Craft

Forex Factory® is a brand of Fair Economy, Inc.

Terms of Service / ©2022