• Home
  • Forums
  • Trades
  • News
  • Calendar
  • Market
  • Brokers
  • Login
  • Join
  • User/Email: Password:
  • 6:43pm
Menu
  • Forums
  • Trades
  • News
  • Calendar
  • Market
  • Brokers
  • Login
  • Join
  • 6:43pm
Sister Sites
  • Metals Mine
  • Energy EXCH
  • Crypto Craft

Options

Bookmark Thread

First Page First Unread Last Page Last Post

Print Thread

Similar Threads

4 Hour Strategy Macd+other Indicator 21 replies

average true range for 1 hour and 4 hour charts 2 replies

X-1102 1 hour , 4 hour and daily Tf trades 7 replies

Create a verticle line at certain hour for every certain hour 16 replies

Is the "4 Hour Strategy (MACD)" the best system here at FF? 20 replies

  • Commercial Content
  • /
  • Reply to Thread
  • Subscribe
  • 12,921
Attachments: 4 Hour Strategy (MACD)
Exit Attachments

4 Hour Strategy (MACD)

  • Last Post
  •  
  • 1 13961397Page 139813991400 1578
  • 1 Page 1398 1578
  •  
  • Post #27,941
  • Quote
  • Edited at 8:47pm Jul 24, 2014 10:46am | Edited at 8:47pm
  •  trademin
  • | Joined Apr 2007 | Status: Member | 910 Posts
Hi,
Thanks for the nice worlds,

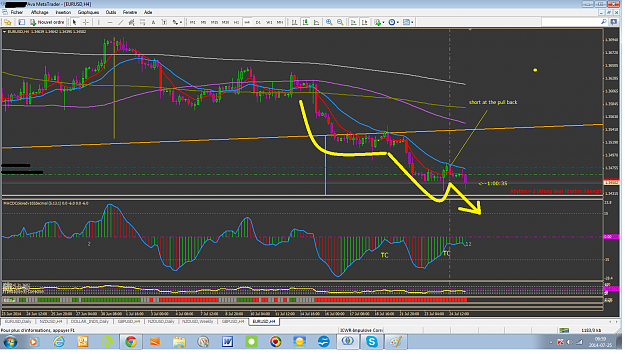
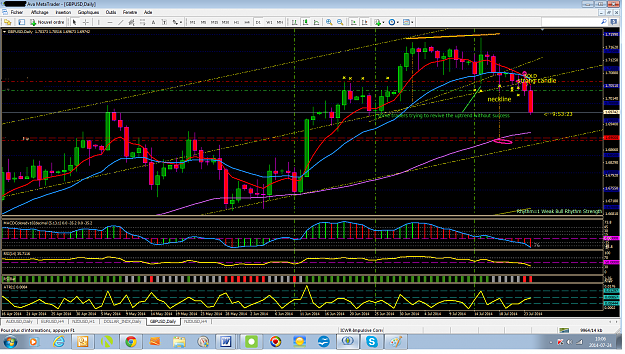
I woke up (late) this morning, and looked at what those pairs stands at now. If they are like me, eyes like and owl: round and standing still!- no big move in the eurusd.
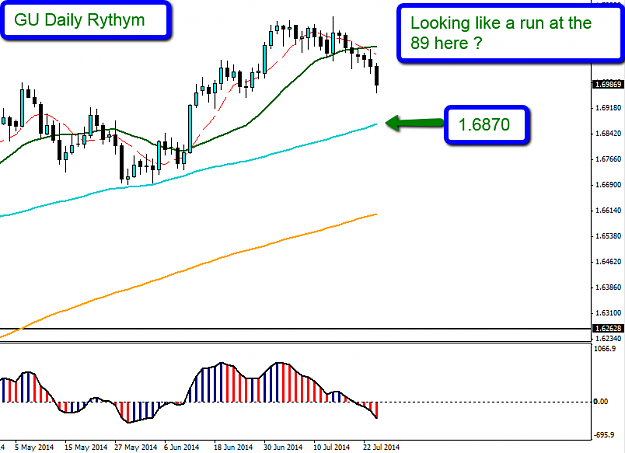
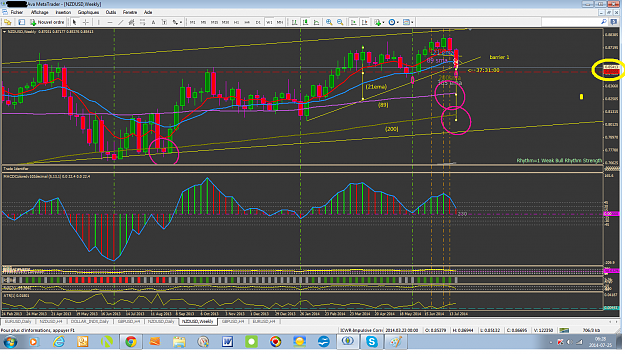
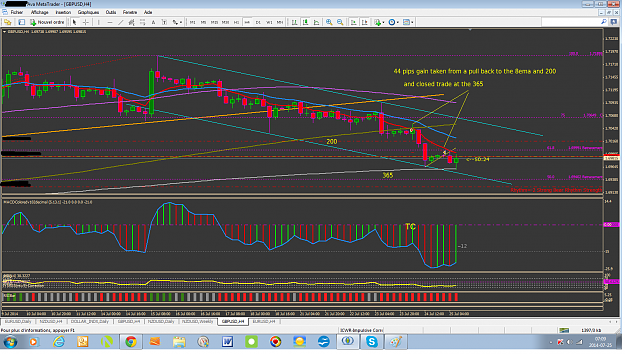
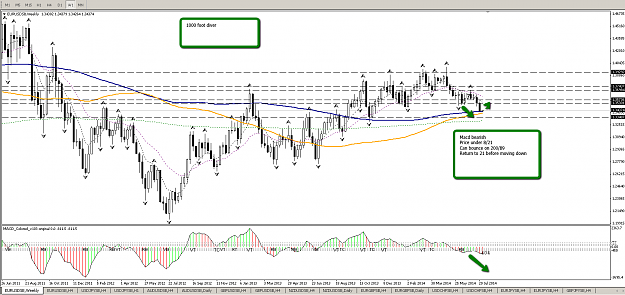
The GBPUSD, doing very well. While I am at it take a look at the chart(daily chart). Look at the yellow circle,(sorry no yellow circle there!) that’s the ATR there. Looks at where those dotted horizontal line there and their respective number at the right. Do you see that? From that we can see that a possibility for the pair to reach the 89sma. Since there is about 85 pips done on the candle, there is still the possibility to reach 130 pips ( as seen on the ATR: .01297)
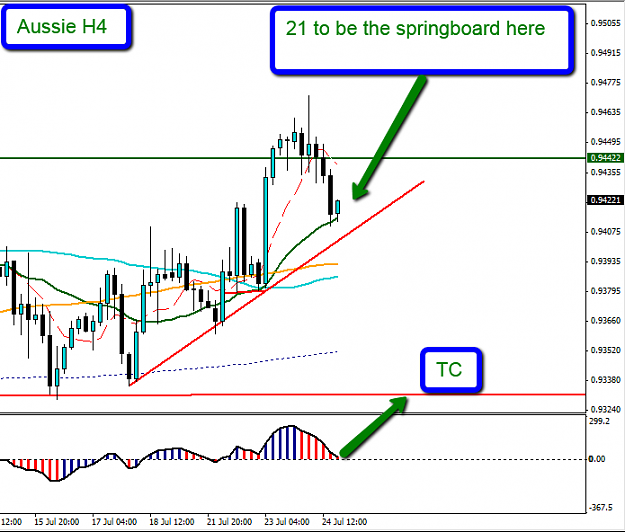
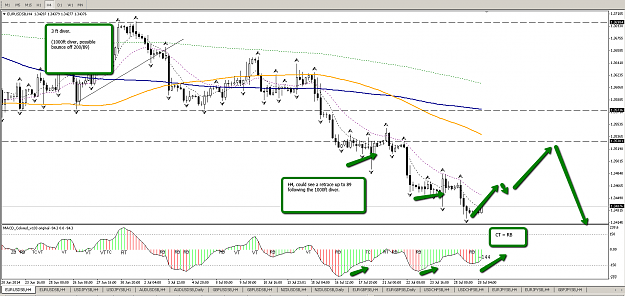
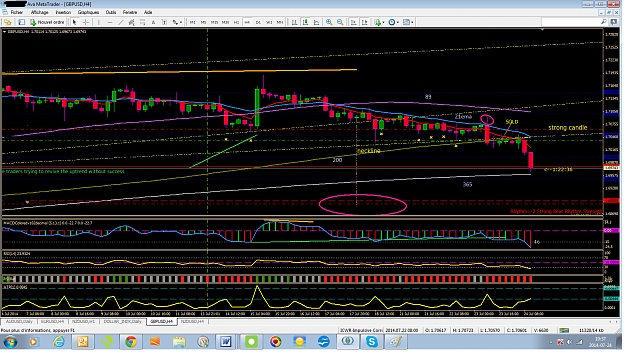
4hrs chart, will the 365 be a barrier?
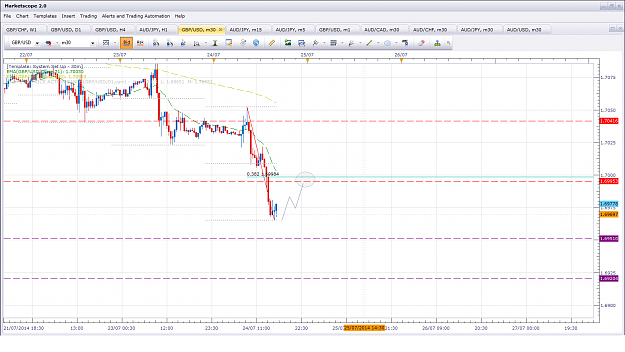
I just want to mention( now on the daily chart) that after the break of the neckline, there is a Strong Candle, which is very often after a break, you are standing just in front of it now,
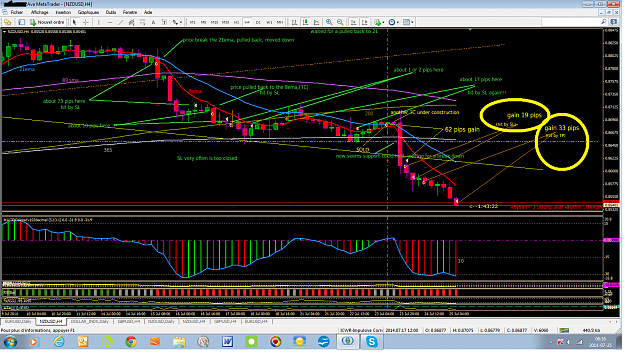
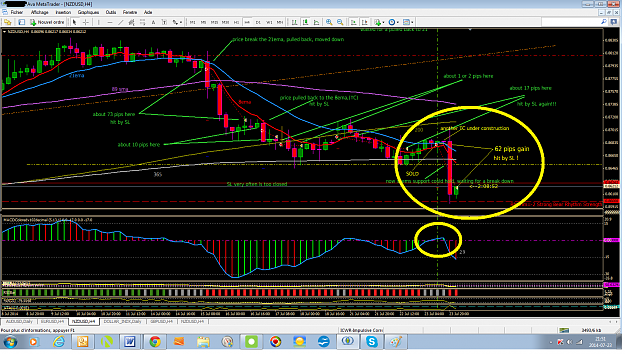
just secure 43 pips
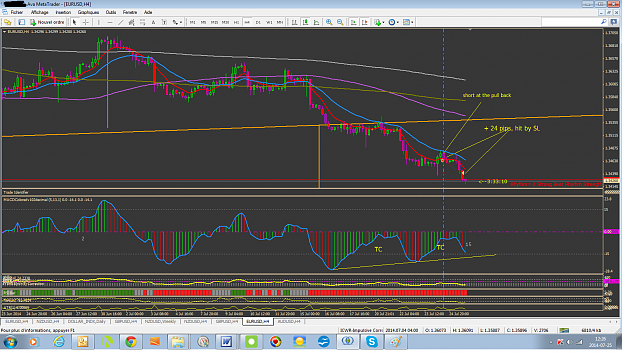
closed trade for now...44 pips hit by SL
Attached Images (click to enlarge)
Click to Enlarge

Name: GBPUSD140723-A.png
Size: 126 KB Click to Enlarge

Name: GBPUSD140723-B.png
Size: 115 KB
Yvon
 
 
  • Post #27,942
  • Quote
  • Jul 24, 2014 11:34am Jul 24, 2014 11:34am
  •  JonnyPip
  • | Joined Nov 2012 | Status: Member | 338 Posts
No problem

I agree on the GBP/USD. I'm looking for some kind of pullback to the 1.6995 level before a move down again, at least to the 1.6951 level. if it breaks through there then I think the next stop seems to be the 89 sma on the daily and the 1.69204 level
Attached Image (click to enlarge)
Click to Enlarge

Name: gbp usd 24.07.14 potential pullback area.png
Size: 90 KB
 
 
  • Post #27,943
  • Quote
  • Edited at 8:50pm Jul 24, 2014 12:34pm | Edited at 8:50pm
  •  trademin
  • | Joined Apr 2007 | Status: Member | 910 Posts
Quoting binnie
Disliked
Quoting trademin
Disliked
{quote} Hi Nic, sorry for taking so much time to answer you , but there it is, the reference to charts are from just above, NZDUSD: Do Will see….I am back in! Because the ride down is not over yet, but that‘s my view. So the little pull back from where I closed the trade, was really a little pull back so far, so I got back in. I think that it could fall along way since there is a larger HS backing a possible move like that, but again, that’s my view, Thanks for the full explanation Yvon, - you are a MACHINE Where
Ignored
...
Ignored
hi Binnie,
" Where do you think this might go ? I have used a measure on the Daily H & S and it could be up to 150pip drop from the neckline breakout. This is around the 0.8480 level. "
NZDUSD:

yea, that could be it. but it could go further down, but there , that's something! just take a look at the weekly chart: if you see what I see! but at this point it is just a possibility, I'll keep it on the back burner for quite a while!

but for now, I will pay attention(see daily chart) to the trend line there(yellow) maybe it will finish the week pick-nicking with some candles there!
Attached Images (click to enlarge)
Click to Enlarge

Name: NZDUSD140724Weekly.png
Size: 130 KB Click to Enlarge

Name: NZDUSD140724Daily.png
Size: 124 KB
Yvon
 
 
  • Post #27,944
  • Quote
  • Jul 24, 2014 5:00pm Jul 24, 2014 5:00pm
  •  binnie
  • | Joined Dec 2010 | Status: invisible | 847 Posts
Quoting JonnyPip
Disliked
No problem I agree on the GBP/USD. I'm looking for some kind of pullback to the 1.6995 level before a move down again, at least to the 1.6951 level. if it breaks through there then I think the next stop seems to be the 89 sma on the daily and the 1.69204 level {image}
Ignored
Howdy JP - nice to see you back round here again. Look forward to learning from you too. Yvon seems to get landed with all our problems for sure but thats what you have to expect when you trade the way he does - LOL.
I recently took the Pound off my radar - I found I was spending too much time jumping between pairs and not seeing what I should be.
I have had a quick look at the Daily to see if it confirms your idea and the Rythym shows a break down thru the 21 , a minor pullback to it and now started the down run to the 89.
Hope it goes well for you.

Attached Image (click to enlarge)
Click to Enlarge

Name: GU_Daily_25_Jul.png
Size: 33 KB
 
 
  • Post #27,945
  • Quote
  • Jul 24, 2014 5:10pm Jul 24, 2014 5:10pm
  •  binnie
  • | Joined Dec 2010 | Status: invisible | 847 Posts
Quoting trademin
Disliked
{quote}{quote} hi Binnie, " Where do you think this might go ? I have used a measure on the Daily H & S and it could be up to 150pip drop from the neckline breakout. This is around the 0.8480 level. " yea, that could be it. but it could go further down, but there , that's something! just take a look at the weekly chart: if you see what I see! but at this point it is just a possibility, I'll keep it on the back burner for quite a while! but for now, I will pay attention(see daily chart) to the trend line there(yellow) maybe it will finish the...
Ignored
Good morning Yvon - nice trades my friend. Thanks for continuing to support us all.
A picnic could be what we are in forwith the Kiwi. My H1 chart shows a nice consolidation here. My guess is the Picnic suggestion - just taking a breather from the fast run down. Still more to come as you have indicated . The one thing I have trouble getting my head around is the relationship we have with our Big Brother - the Aussie.
Kiwi dropping like a stone - Aussie continuing to climb just as fast.
If the Aussie springboard works from the 21 , I will try a quick play for 30 -40 pips before weekend close.

Attached Image (click to enlarge)
Click to Enlarge

Name: Kiwi_H1_25_Jul.png
Size: 30 KB


Attached Image (click to enlarge)
Click to Enlarge

Name: AU_25_Jul_H4.png
Size: 37 KB
 
 
  • Post #27,946
  • Quote
  • Jul 24, 2014 6:29pm Jul 24, 2014 6:29pm
  •  trademin
  • | Joined Apr 2007 | Status: Member | 910 Posts
Quoting JonnyPip
Disliked
No problem I agree on the GBP/USD. I'm looking for some kind of pullback to the 1.6995 level before a move down again, at least to the 1.6951 level. if it breaks through there then I think the next stop seems to be the 89 sma on the daily and the 1.69204 level {image}
Ignored
hi Jonny,

agree with you, and making a TC at the same time!
Yvon
 
 
  • Post #27,947
  • Quote
  • Jul 25, 2014 6:42am Jul 25, 2014 6:42am
  •  trademin
  • | Joined Apr 2007 | Status: Member | 910 Posts
hi,
NZDUSD:
the pull back very weak:only to the 8ema(in red)
(charts are 4hrs and weekly charts.)
the last 2 trades +19 and +33 pips. Again , SL too close to action caused getting back in often, it is my weakness. not a weakness of the system, it is mine.
if the pair breaks the barrier 1, then it could go another 40 pips lower, as next target (0.8500) then those targets in pink circles below the lower trend line of the channel:
0.8300, 0.8100, 0.7900 and 0.7700 which is the last low at left.
Attached Images (click to enlarge)
Click to Enlarge

Name: NZDUSD140724B.png
Size: 126 KB Click to Enlarge

Name: NZDUSD140724C.png
Size: 124 KB
Yvon
 
 
  • Post #27,948
  • Quote
  • Edited at 12:31pm Jul 25, 2014 7:02am | Edited at 12:31pm
  •  trademin
  • | Joined Apr 2007 | Status: Member | 910 Posts
EURUSD: not too much development

now in a free trade
now secured 24 pips
trade closed: 24 pips, hit by the SL
It's friday, and a positivre divergence on the macd, that was a tight SL,

but again ,here, I can see the pair bouncing on the 21ema(in blue), making TC at the same time. It could have been just one trade from way above. Since my SL is hit often, then I have to get back in later. I have a problem with that.

the chart is 4hrs:
Attached Images (click to enlarge)
Click to Enlarge

Name: EURUSD140724.png
Size: 109 KB Click to Enlarge

Name: EURUSD140724B.png
Size: 116 KB
Yvon
 
 
  • Post #27,949
  • Quote
  • Jul 25, 2014 7:16am Jul 25, 2014 7:16am
  •  trademin
  • | Joined Apr 2007 | Status: Member | 910 Posts
GBPUSD:
easy trade, I just woke up and the trade was done and closed: 44 pips gain. I choose the 365 as target since it is friday, just as precaution, the space is widening between the 8ema and the 21ema, so still some room to go I guess, will see...
Attached Image (click to enlarge)
Click to Enlarge

Name: GBPUSD140723-c.png
Size: 110 KB
Yvon
 
 
  • Post #27,950
  • Quote
  • Jul 26, 2014 11:01am Jul 26, 2014 11:01am
  •  tzolov
  • | Joined Jun 2013 | Status: Member | 54 Posts
Quoting trademin
Disliked
GBPUSD: easy trade, I just woke up and the trade was done and closed: 44 pips gain. I choose the 365 as target since it is friday, just as precaution, the space is widening between the 8ema and the 21ema, so still some room to go I guess, will see... {image}
Ignored
Could you share your MACD indicator? 10x in advance!
I want money!
 
 
  • Post #27,951
  • Quote
  • Edited at 12:59pm Jul 26, 2014 12:34pm | Edited at 12:59pm
  •  trademin
  • | Joined Apr 2007 | Status: Member | 910 Posts
Quoting tzolov
Disliked
{quote} Could you share your MACD indicator? 10x in advance!
Ignored
Hi tzolov,

there it is!
this is the one I use

someone asked me something similar to your question on post 25280
there's some other thing that could be helpful. one of them is a template, but before using it , you need to install the appropriates indicators.

have a nice day,
Attached File
File Type: ex4 MACDColoredv102decimal.ex4   7 KB | 213 downloads
Yvon
 
 
  • Post #27,952
  • Quote
  • Jul 27, 2014 8:42pm Jul 27, 2014 8:42pm
  •  nic73
  • | Joined Feb 2013 | Status: Member | 439 Posts
Hi Yvon,

Thanks for your reply (Post 27935). You shouldn't need to say sorry for late reply as I can't thank you enough for taking the time to be so patient to me.

I could never analysis the chart the way you have done it. You are so alert and so good at reading the charts. When will I master that skills you have acquired?

So you explained that the analysis is based on the RT and SHS that were formed on the daily and H4 TF and you took the trade. And that price has been bouncing on 21ema many times and unable to break it strong enough to reverse the trend. That gave you the clue that the market will eventually move south. Is this correct?

But I still can't understand why you entered the trade at where you did? Why not entry at the candle just before the last (huge, red) candle. Where is the indication that that's the time for entry? The MACD was not showing any sign that it was going to go downwards (it was pointing upwards). I don't see the TC coming. I look at it, and I thought price could go either side way, up or down. How did you anticipate it was going to go down 2 candles later?

Sorry I have to trouble you to explain further. Please don't mind.

Thanks.

Nicholas
 
 
  • Post #27,953
  • Quote
  • Jul 27, 2014 9:42pm Jul 27, 2014 9:42pm
  •  nic73
  • | Joined Feb 2013 | Status: Member | 439 Posts
Quoting binnie
Disliked
Quoting trademin
Disliked
{quote} Hi Nic, sorry for taking so much time to answer you , but there it is, the reference to charts are from just above, NZDUSD: Do Will see….I am back in! Because the ride down is not over yet, but that‘s my view. So the little pull back from where I closed the trade, was really a little pull back so far, so I got back in. I think that it could fall along way since there is a larger HS backing a possible move like that, but again, that’s my view, Thanks for the full explanation Yvon, - you are a MACHINE Where
Ignored
...
Ignored
Somehow I missed this post last Thursday, Binnie.

Ok when you re-entered the trade, at which point did you do it and what was your stop loss? My concern is, was it far away from 21ema?

Thanks.

Nicholas
 
 
  • Post #27,954
  • Quote
  • Edited Jul 28, 2014 3:45am Jul 27, 2014 9:53pm | Edited Jul 28, 2014 3:45am
  •  nic73
  • | Joined Feb 2013 | Status: Member | 439 Posts
For this week,

EURUSD
I told my story on the chart below - H4 TF of the possible move for EURUSD, for this week. BUT, I don't know what to interpret from the Daily TF. On the Weekly TF however, price is almost there on 89, 200 and 365 moving averages. So does this mean that price could possibly reverse to 21ema?

Possible entry on H4 after close of the last candle, that is if a 3rd RT forms?

Attached Image (click to enlarge)
Click to Enlarge

Name: EURUSD_Anticipation_H4_28_July_2014.png
Size: 35 KB

NZDUSD, AUDUSD, GBPUSD
Prices are 40+ pips away from 21ema. So time to wait for pull back to 21ema.

I am learning here how to read H4, Daily and Weekly TF and put them together is predict the market (rhythm). So will be grateful if someone could help me out.

Thank you all so much for your insight.

Nicholas

Correction: RT should be RB. Sorry!!!
 
 
  • Post #27,955
  • Quote
  • Edited at 11:16pm Jul 27, 2014 11:10pm | Edited at 11:16pm
  •  trademin
  • | Joined Apr 2007 | Status: Member | 910 Posts
Quoting nic73
Disliked
Hi Yvon, Thanks for your reply (Post 27935). You shouldn't need to say sorry for late reply as I can't thank you enough for taking the time to be so patient to me. I could never analysis the chart the way you have done it. You are so alert and so good at reading the charts. When will I master that skills you have acquired? So you explained that the analysis is based on the RT and SHS that were formed on the daily and H4 TF and you took the trade. And that price has been bouncing on 21ema many times and unable to break it strong enough to reverse...
Ignored
Hi Nic,

“So you explained that the analysis is based on the RT and SHS that were formed on the daily and H4 TF and you took the trade. And that price has been bouncing on 21ema many times and unable to break it strong enough to reverse the trend. That gave you the clue that the market will eventually move south. Is this correct?”

My analysis is based on the strategy’s rules.
What the market is doing has been identified and given names so we, as traders, can see them. Otherwise a chart is just full of ups and downs. Those given names are there as the road signs are there for you to see a (or a RT or SHS) meaning, something to you…and knowing that, you should act accordingly.


Take the example on post 27923.( on the chart below

Now look at the first trade:
Look before I took it: you have to say that it is by the rules that say that price in above the 21ema, and it will come back to it eventually. It did happen when the price touched the 21ema again. Normally in an up trend we should expect the price to keep moving up.

Then by the rules the price should bounce (up) again. ---which didn’t happens! Part of the rules too! Or break the 21ema. But the rules say that when it breaks the 21ema it tends to pull back to it before moving away: which happens just before I took the trade.

I was expecting that “move back” to the 21ema (that was the green candle). Then as the time went on, there a red candle: that is the “move away”.( that’s the 73 pips trade there)`.later I closed the trade.
Yes I closed it! Was that action part of the rules? No! I should have kept that trade open, because my SL should have been located above the 21ema.

Now this is one part of my view that I just did above.

Let’s take one step further.

“So you explained that the analysis is based on the RT and SHS that were formed on the daily and H4 TF and you took the trade”
Let’s talk about that:

Phillip Nel gave the name to this market behaviour: he identified it as a counter trend (CT) and if you take a RT your target (TP) should be the 21ema. The reason: it is because your deal is against the trend and usually it is a short live trade.
He talks also about 3 sisters,
And in his pdf on first page he mentioned the SHS, (a drawing) and where you should open a trade there.

My point is this: my trades are based on the strategy. Where it seems that there is something different, is where I see “different” importance to figures (RT,SHS, etc.).

If I see someone takes a dive from the side of a swimming pool, well, I won’t call a brass band.( he will probably land on the 21 ema!) But if he is plunging from a 200 feet stands, that‘s something isn't? And probably there are people there to see this event. But if he plunges from 1000 feet, more people are around, well, maybe, I should call the ambulance, because he will probably have a “landing” 30 feet below the earth!!!(it has been a strong move bearish for quite some time!)

But the problem is this:
If you see the guy already down to about 3 feet above the swimming pool, you won’t even bring a solo song, but those who have seen it falling from 1000 feet high knows , have an idea what will happen to that guy,they will be shouting very hard!
The same when you are able to see a weekly chart or a longer term chart and see it from where the price is standing now (4hrs chart) and where it should “normally” land!
I do not know if this explanation fits your needs, but that’s a way to explain my view…

When Phillip Nell did his videos called “weekly anticipation” he wanted us to see the diver from the 1000 feet stand.- again Phillip Nel did a very fine work on this tread: thank you M. Nel!

Have a nice day!
Attached Image (click to enlarge)
Click to Enlarge

Name: NZDUSD140723-E.png
Size: 141 KB
Yvon
 
 
  • Post #27,956
  • Quote
  • Jul 28, 2014 2:39am Jul 28, 2014 2:39am
  •  nic73
  • | Joined Feb 2013 | Status: Member | 439 Posts
Hi Yvon,

Thanks for replying. What great patience you have! Appreciate that very much.

I understand your explanation on the part about post 27923. Price pulling back to 21ema, and move away. Ok. That's something I understand. However, I think m level of understand and insight on chart reading and analysis is way apart. You are a much more experience and expert in trading than I am. So I have difficult understanding your explanation. I still don't see how you entered that trade (the one you gained 62pips before with stopped out). That trade came very fast, was it a early entry (like 1HR)? Beside, the market was still hovering around the 21ema and I don't see it was going to break the 21ema and go south so swiftly.

But thanks for trying to explain. What is made plain to you, is what I cannot see or understand.

Appreciate your effort.

Nicholas
 
 
  • Post #27,957
  • Quote
  • Jul 28, 2014 3:21am Jul 28, 2014 3:21am
  •  yaakruay
  • | Joined Feb 2013 | Status: Member | 482 Posts
Quoting trademin
Disliked
{quote} Hi Nic, “So you explained that the analysis is based on the RT and SHS that were formed on the daily and H4 TF and you took the trade. And that price has been bouncing on 21ema many times and unable to break it strong enough to reverse the trend. That gave you the clue that the market will eventually move south. Is this correct?” My analysis is based on the strategy’s rules. What the market is doing has been identified and given names so we, as traders, can see them. Otherwise a chart is just full of ups and downs. Those given names are...
Ignored
Brilliant, awesome, standing ovation required.

Is this an example of what you are trying to teach us?

The weekly, could be some bounce off the 89/200 before continuing down.

H4, showing us a bearish head and shoulder
a RB and a possible return to the 21 and then the 89.

Little brother following big brother....
Attached Images (click to enlarge)
Click to Enlarge

Name: 2014-07-21_0726.png
Size: 82 KB Click to Enlarge

Name: 2014-07-28_0817.png
Size: 109 KB
 
 
  • Post #27,958
  • Quote
  • Jul 28, 2014 3:51am Jul 28, 2014 3:51am
  •  nic73
  • | Joined Feb 2013 | Status: Member | 439 Posts
Quoting yaakruay
Disliked
{quote} Brilliant, awesome, standing ovation required. Is this an example of what you are trying to teach us? The weekly, could be some bounce off the 89/200 before continuing down. H4, showing us a bearish head and shoulder a RB and a possible return to the 21 and then the 89. Little brother following big brother.... {image} {image}
Ignored
Hi Richard,

I took a CT trade on this pair (on demo account). The 3 RB there which are the 3 little sisters (that's Nel's term).

But my anticipation is that price will pull back to 21ema on H4 TF. But you say to weekly, which I don't quite understand why?

Thanks for posting.

Nicholas
 
 
  • Post #27,959
  • Quote
  • Jul 28, 2014 7:32am Jul 28, 2014 7:32am
  •  okrim
  • | Joined Jul 2014 | Status: Member | 143 Posts
Hello everyone,

this is my first post here. I am a beginner in trading, from Italy, so sorry for my english. After check many strategies, i found this one of Phillip Nel, that i feel it is the ONE that i will follow, even the other one (5 minute TF of Phillip Nel sounds good for me, when i have time to sit in front of the computer).
I like these strategies because after i tried others with a lot of indicators i lost myself with them light, arrows, full colors, ... I believe that the price action is the main school. Also i was getting mad to look at the computer all day searching for a good setup with low time frames. This Phillip's method i like much more because i have to check the computer just every 4 hours ( but usually i don't check during my sleeping time). And the philosophy of the rythm of the market is amazing.
So first at all thank you Phillip for your effort and your work. I am learning a lot from you and from the other people in this thread. THANKS!

I am happy to find that this system is still follow from many people and i can learn a lot from you too.

So, thanks to everyone!

About EUR/USD i am waiting for a signal to sell. I think he will go down, even if as you said there are those three sister that make me doubtful, because also i can see since the EUR/USD dropped (15/7/14), he bounced two time to the 21MA, and the first fall was bigger than the second and now is consolidating another bounce that make the third fall smaller than the second. I mean we have three falls. The first big, the second less big, the 3rd even less big. Could be the time for changing of the trend?
Thanks you again, good day and good trading.

Mirko
 
 
  • Post #27,960
  • Quote
  • Jul 28, 2014 8:03am Jul 28, 2014 8:03am
  •  trademin
  • | Joined Apr 2007 | Status: Member | 910 Posts
Quoting nic73
Disliked
Hi Yvon, Thanks for replying. What great patience you have! Appreciate that very much. I understand your explanation on the part about post 27923. Price pulling back to 21ema, and move away. Ok. That's something I understand. However, I think m level of understand and insight on chart reading and analysis is way apart. You are a much more experience and expert in trading than I am. So I have difficult understanding your explanation. I still don't see how you entered that trade (the one you gained 62pips before with stopped out). That trade came...
Ignored
hi Nic,
maybe by adding some more explanations:
all I took was on the 4hrs chart. there it is:

Ok, let’s take the 62 pips case:
…
Now, there is a big crowd , the diver is almost touching the water, he is at about 3 feet from getting wet. He is coming fast, his weight is more than triple, and yes I feel the weight accumulated from the daily, weekly chart, since he is coming down from 1000feet. The form of his body looks totally normal, but don’t stand below him,( or counter trend!) it could be fatal! Right there he is three candles from my entry! That’s close! I know that I will have to pull the trigger fast! One last thing, is he over the swimming pool? I just need the price to touch the 21 ema! There it is! More than touching, he is just a bit over the 21ema, that‘s the candle before I get in the trade.

I am almost there, almost there! I just need a move away now! There it is, that’s the next candle, the red one, just there! Then I find myself lucky, the candle stood at the same height as the candle before, that’s a good set up! I just need to take it from below the 21ema now! There it is! So I pulled the trigger, I am in the trade! Now I look what will be next, knowing that it won’t be higher than my trigger candle! But would draw another TC down there! I am glad! It didn’t get higher, but about the same height as the first pull back to the 21ema.
Wow! Now I a expecting a big splash in the water! A strong candle! Soon! Wow! There it is! Right there! That the long red can candle! What a splash! I was scared first since the price moved a bit higher than the recent action, But there it is a marvellous 110 pips long red candle! What a dive! Sure he should get deeper in the water I guess!

That’s the way I did that trade, sure it is a bit imaginary, but that’s the way I have found!!!
Hope you have enjoyed the scene, it was almost in HD!
Attached Image (click to enlarge)
Click to Enlarge

Name: HS a Beauty-26 nzd140724.png
Size: 104 KB
Yvon
 
 
  • Commercial Content
  • /
  • 4 Hour Strategy (MACD)
  • Reply to Thread
    • 1 13961397Page 139813991400 1578
    • 1 Page 1398 1578
0 traders viewing now
  • More
Top of Page
  • Facebook
  • Twitter
About FF
  • Mission
  • Products
  • User Guide
  • Media Kit
  • Blog
  • Contact
FF Products
  • Forums
  • Trades
  • Calendar
  • News
  • Market
  • Brokers
  • Trade Explorer
FF Website
  • Homepage
  • Search
  • Members
  • Report a Bug
Follow FF
  • Facebook
  • Twitter

FF Sister Sites:

  • Metals Mine
  • Energy EXCH
  • Crypto Craft

Forex Factory® is a brand of Fair Economy, Inc.

Terms of Service / ©2022