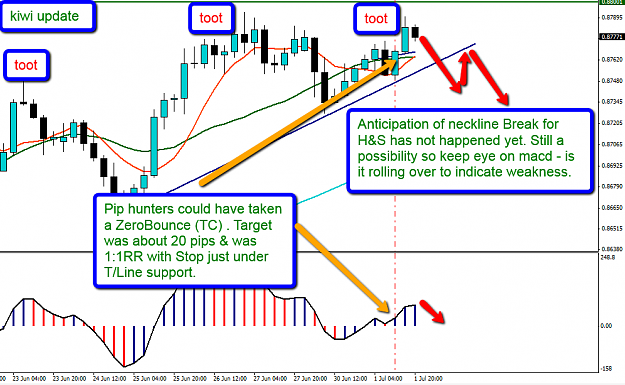
Disliked{quote} Charts a bit messy but I guess this is what you are thinking Richard ? Yvon will be the better one to answer this. He is the go- to guy when it comes to H & S. What do you reckon Yvon ? My initial response is that even though we are H4 traders , we do sometimes rely on the H1 to get early entries. Why not use the H1 pattern here to go short even if it is just down to the Support on that H4 Neckline??? I wouldn't just enter at a break of the neckline though, instead I would want to play conservative and let the pattern complete with the trusty...Ignored
Hi, concerning HS. My view is this :
It is a formation set for a trend change. They are all beautiful because as mentioned earlier it implies a trend change possibility in the near future. I found them very “rigid structure” because every time this structure start to be drawn in a particular market then I pay more attention to the evolution expressed by candles, because the coming candles should confirm the direction of the market, staying in harmony with the new direction and soon I should see a breakout of the neck line / support line.
" My initial response is that even though we are H4 traders , we do sometimes rely on the H1 to get early entries." as you said it is from the 4 hrs chart "
The 4hrs chart is the base, other TF are zooming in. Decision should be taken from what is expressed in the 4hrs. I agree with you Binnie
The 1hr chart is (for me) a “detailed” motion of the 4hrs chart. From the 1 hr chart I have now 4 candles that will build one candle on the 4 hrs chart, easier to follow the trend in evolution.
But again, all time frames are the expression of the market. How many “5minutes period” changes are in a 4hrs period candle…Yes! Many ups and downs! 48 to be precise, it could get confusing some time! But by taking the 1 hrs period, the decision based on the 4hrs should be easier to see since I can see “reasonable” details unfolding.
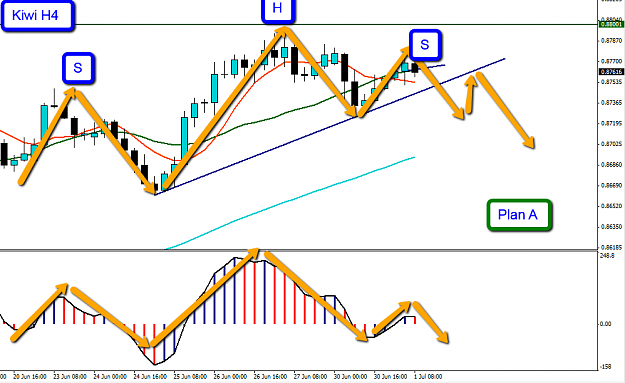
HS are Round Tops usually three in a row. And as per the rules RT are counter trend- yes! Said in other words it means also “a possibility of a trend change!”
But in the case of HS it just means that three possibilities of a trend change IN A ROW! WOW! I guess the market just gives a warning that a possible break out of support line could happen soon...
One car horn, well, it could be a friend passing by and he/she just want to salute me while moving on
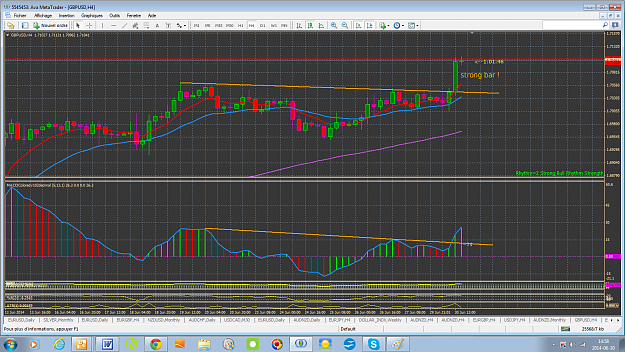
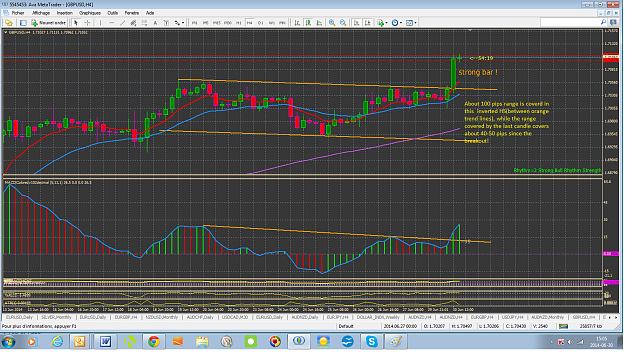
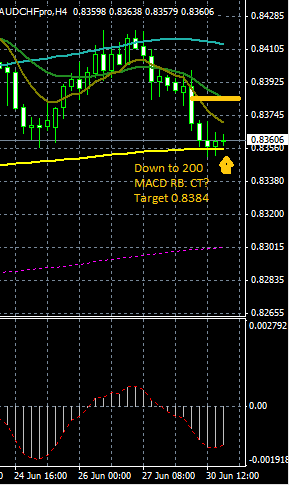
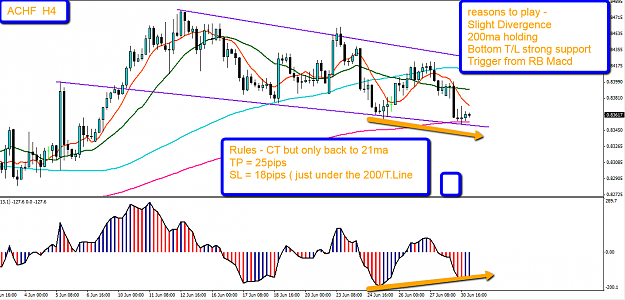
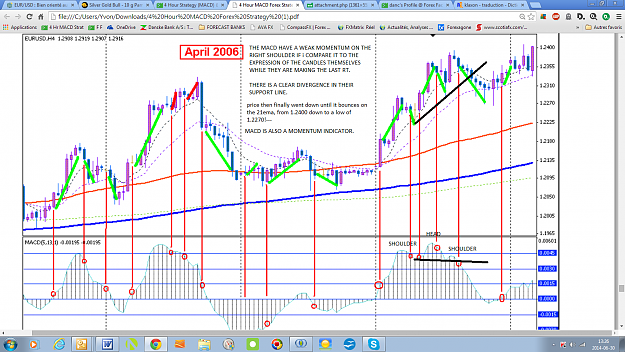
I have seen very often a “strong bar” at the “neckline/support line” break out. And I have seen also divergence expressed by macd harmonically confirming the possible direction of the pair. Don’t forget that the macd is a “momentum indicator” and if there is a weakness compare to the candles’s expression, it should get my very attention! it is very helpful to see on a chart the macd indicator too, it helps to see the market direction: anticipating. As example : the chart below, done by Philip Nel where I have added some drawing, some lines an some comments. It is taken from the first page, the pdf down below the page. again, observe the effect done on the macd while the chart is making candles an HS or triple RTs)
If there is a strong bar at the break out, if it happens, just means (for me) that a clear gathering of traders had anticipated that particular move, but again they are RTs!
the strategy is based on the 4hrs time frame, I should stay with the rules.
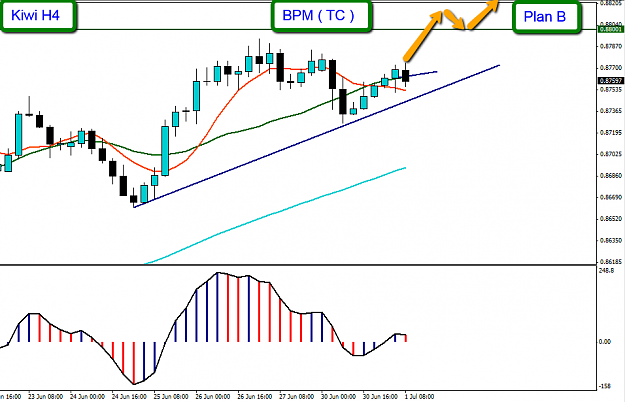
The action is that there were RTs there all having the same support. To be conservative, waiting for a pull back and move away after the support break out is acting safer, less risky.
Questions are welcome,
Attached Image (click to enlarge)
Yvon