{quote} thanks for the reply 2121 ..good call wasnt looking at the news ..i pulled the chart up looking for past possible entries after work ,,from what ive seen not a lot of entries at the moment ... due to sideways movement .
Ignored
Your entry looks close to what we are trying to find but still has some nuances.Yeah, no trades from me today, my last one was yesterday AJ @ 95.54, got a 4:1..
{quote} Your entry looks close to what we are trying to find but still has some nuances.Yeah, no trades from me today, my last one was yesterday AJ @ 95.54, got a 4:1..
Ignored
yeah i can c its not a perfect entry due to the break higher on the left earlier in the day ...
Hi guys This is a H4, I love this time frame {image}
Ignored
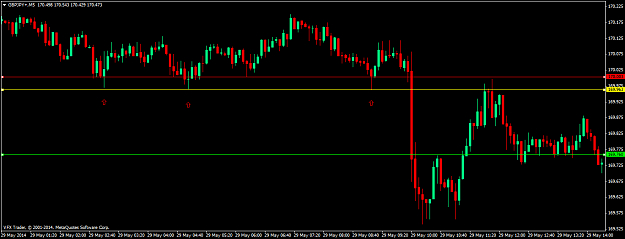
hi jymarc ..i dont know how your trade went mate ..good i hope ...the entry wasnt strictly to the criteria as i see it ..
the pullback off point 2 rose above the previous tops so making it a notrade for what what rifid looks for ..
just for education purposes ....all the best.
{quote} hi jymarc ..i dont know how your trade went mate ..good i hope ...the entry wasnt strictly to the criteria as i see it .. the pullback off point 2 rose above the previous tops so making it a notrade for what what rifid looks for .. just for education purposes ....all the best.
Ignored
Thanks Roofer for mentioning this mistake.
I did take a bit of a loss on this one (demo). Will keep my eyes opened next time.
Regards
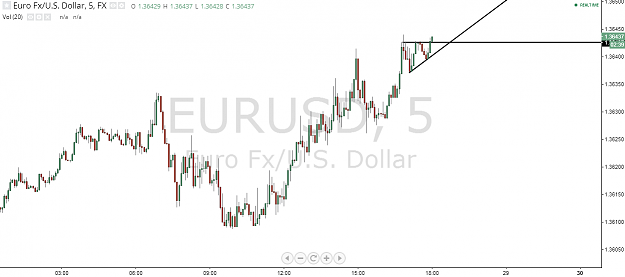
Hi, you must take the candle high not close/open, then the second point would be lower. If you flip to H1, you would find out a resistance @ 1.36511 and last it is end of NY session and it's friday.
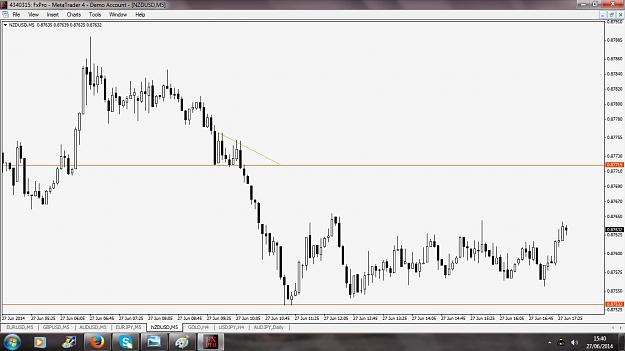
still hunting them down at the moment NZU ...only one ive found today ...anybody taken a trade ? it went to 18 pips minus the spread .. {image}
Ignored
Hi, I personally did not find any trades today, but I usually leave the desk before LC on fridays. Talking about NU trade, if you flip to H1 you would see that PA is iffy and no clear direction, you would also find a support level @ 0.8766 clearly visible even from the M5. The setup was close but it seemed to me a bit too steep.
{quote} Hi, I personally did not find any trades today, but I usually leave the desk before LC on fridays. Talking about NU trade, if you flip to H1 you would see that PA is iffy and no clear direction, you would also find a support level @ 0.8766 clearly visible even from the M5. The setup was close but it seemed to me a bit too steep.
Ignored
2121 ..thanks for feedback ..certainly reasons not to take the trade ...but as always the market does what it wants and was targeting the 53 support level ..
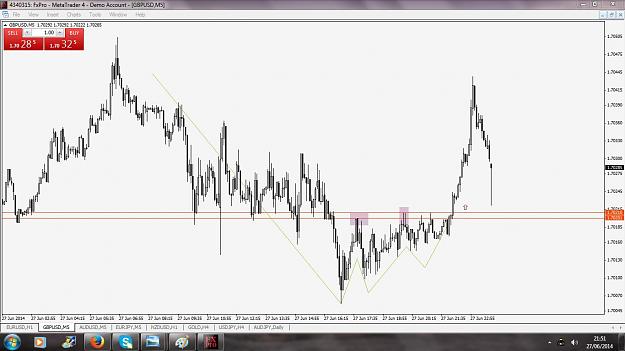
GU ...i was eyeing this one up earlier before it broke higher but decided it was friday evening so left alone ..even so worked out ..this looked valid to me... may disagree ..uptrend with pullback and bounce of round number and pressure building on point one ..have good weekend .
rifid, or someone else that is certain of this answer;
• Mention is made to "pinny" candlesticks. Does this observation apply to pins in both directions or only pins which seem to get rejected at each attempt to break the price level for entry?
I have my own ideas on this however clarification from you would be much more valid than my thoughts.
.This is interesting one as it looks like a side ways market, but if you squash your chart up a bit you will see that it is just a fairly long consolidation of a down trend. You will also notice that the last retracement is fairly pinny which is usually not a good sign but in this case you can see each of the candle sticks ends down in a hangman style fashion indicating that the sellers are stronger than the buyers ,then the buyers finnally give up and the price crashes thru your entry and hits your T/P in less than 5min, The charts i have shown...
Ignored
hi Rifid
as you mentioned SL should be 5 pips ,but I see here in the chart is only 4 pips, any reason?
thanks
fred
In case I missed this:
1. Is there any guide or restriction on the number of bars between points? Can it be as few as 2 bars?
2. How about the width of the "void"? Can the void be a much greater number of bars than between the points?
I look forward to anyone's reply.
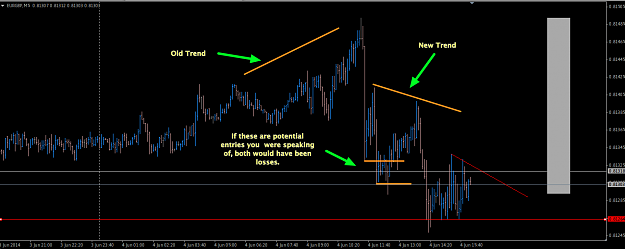
Hi rifid and all contributors and thank you. On pg 13, post #244 "hg2014" posted a diagram which was consistent with my concept of the set up you are showing us. Post #250 from "mc19" shows the chart below; to which your response was (post #252); "Yeh there was a very quick entry there, may reform for another yet" If you have time, would you please show me (us) the "Quick Entry" you mentioned. I have marked up the chart with my interpretation of what I've read up to pg 14 & the last three pages. Thanks, Darryl {image}
Ignored
Hi diamonddbw,
this is not a chart i posted and i can see no legitimet entries here.
In case I missed this: 1. Is there any guide or restriction on the number of bars between points? Can it be as few as 2 bars? 2. How about the width of the "void"? Can the void be a much greater number of bars than between the points? I look forward to anyone's reply.
Ignored
There is no restriction on the number of bars between points as can be seen in the chart examples I have posted, the last retrace before breakout will nearly always be smaller than previous and definetly lower,[for short], last retrace can be as few as 3 bars as long as a void is formed.
rifid, or someone else that is certain of this answer; • Mention is made to "pinny" candlesticks. Does this observation apply to pins in both directions or only pins which seem to get rejected at each attempt to break the price level for entry? I have my own ideas on this however clarification from you would be much more valid than my thoughts.
Ignored
When i refer to 'pinny' candles i am refering to largish wicks both top and bottom, indicating indecision in the market and best to stay out.