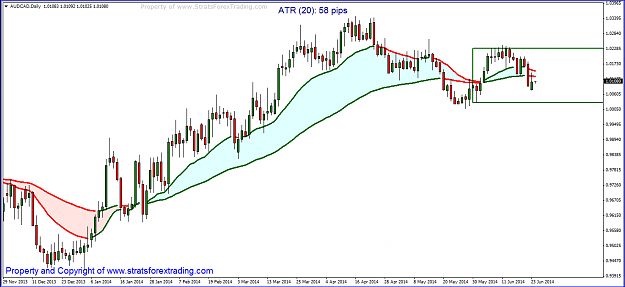
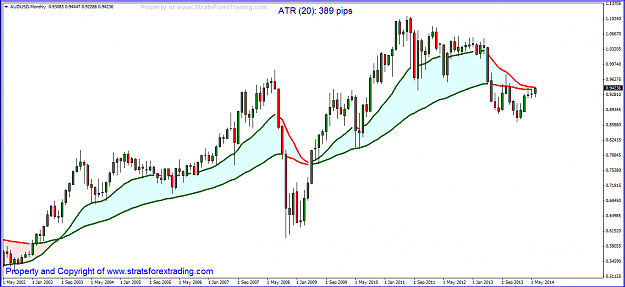
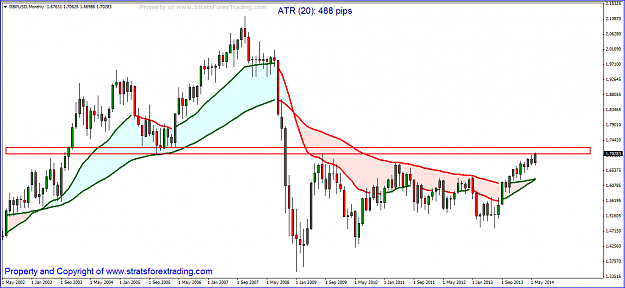
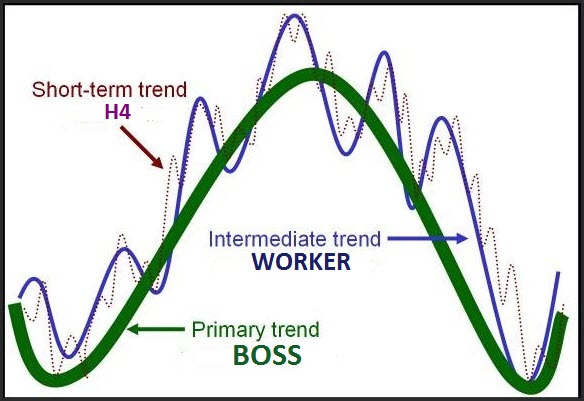
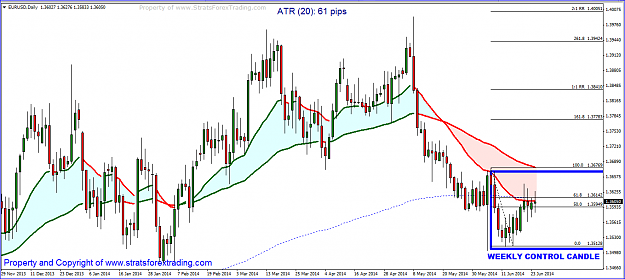
Disliked{quote} Yes, a shorter time frame is always faster but for 90% of its time, PRICE is oscillating around the higher time frame so if the higher time frame is UP we wait for the next lower time frame to finish its down move and then go back in long again. See attached chart. Trend changes are ALWAYS the most difficult no matter what time frame you are on but we watch all our time frames when we suspect a trend change is in play and don't go full bore on the change until our higher time frames confirm it. {image} The candle you identified is a DOJI...Ignored
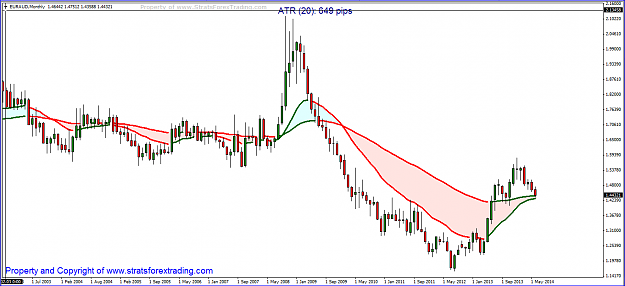
thanks a lot for the explanation. I really like the picture you attached as well, think it does a very good job of showing the way the different time frames interact. A picture speaks a thousand words. Re-evaluating the current EURUSD setup, I also can see that price is currently neutral. Although the candle I posted is a DOJI, I thought that because price closed near the top of its weekly range that it was bullish. I need to perhaps re-read my candle lessons. However, I can now see that even if it was bullish, that seems irrelevant as price has not since even reached the high of that weekly candle and so it was wrong of me to have any kind of long bias. What I'm trying to say is that any candle doesn't mean much if the next candle doesn't follow on. Mistake realized and hopefully learned from. Cheers
Maybe money can't buy happiness, but it can give you freedom.